Search Analytics
Search Analytics opens an embedded OpenSearch Dashboards interface to search and create visualizations of the indexed data.
The Search Analytics tab provides an embedded OpenSearch Dashboards interface that you can use to query and visualize the data in your cloud object storage that has been indexed with ChaosSearch. Search Analytics offers a quick and easy way to start visualizing the value in your event and log files. Combined with the ChaosSearch indexing advantages, Search Analytics offers fast search results, visualizations, alerting on conditions, and all-in-one dashboards for end users.
The following topics describe how to use the Search Analytics interface and some best practices for visualizing and searching using ChaosSearch.
Where to Begin
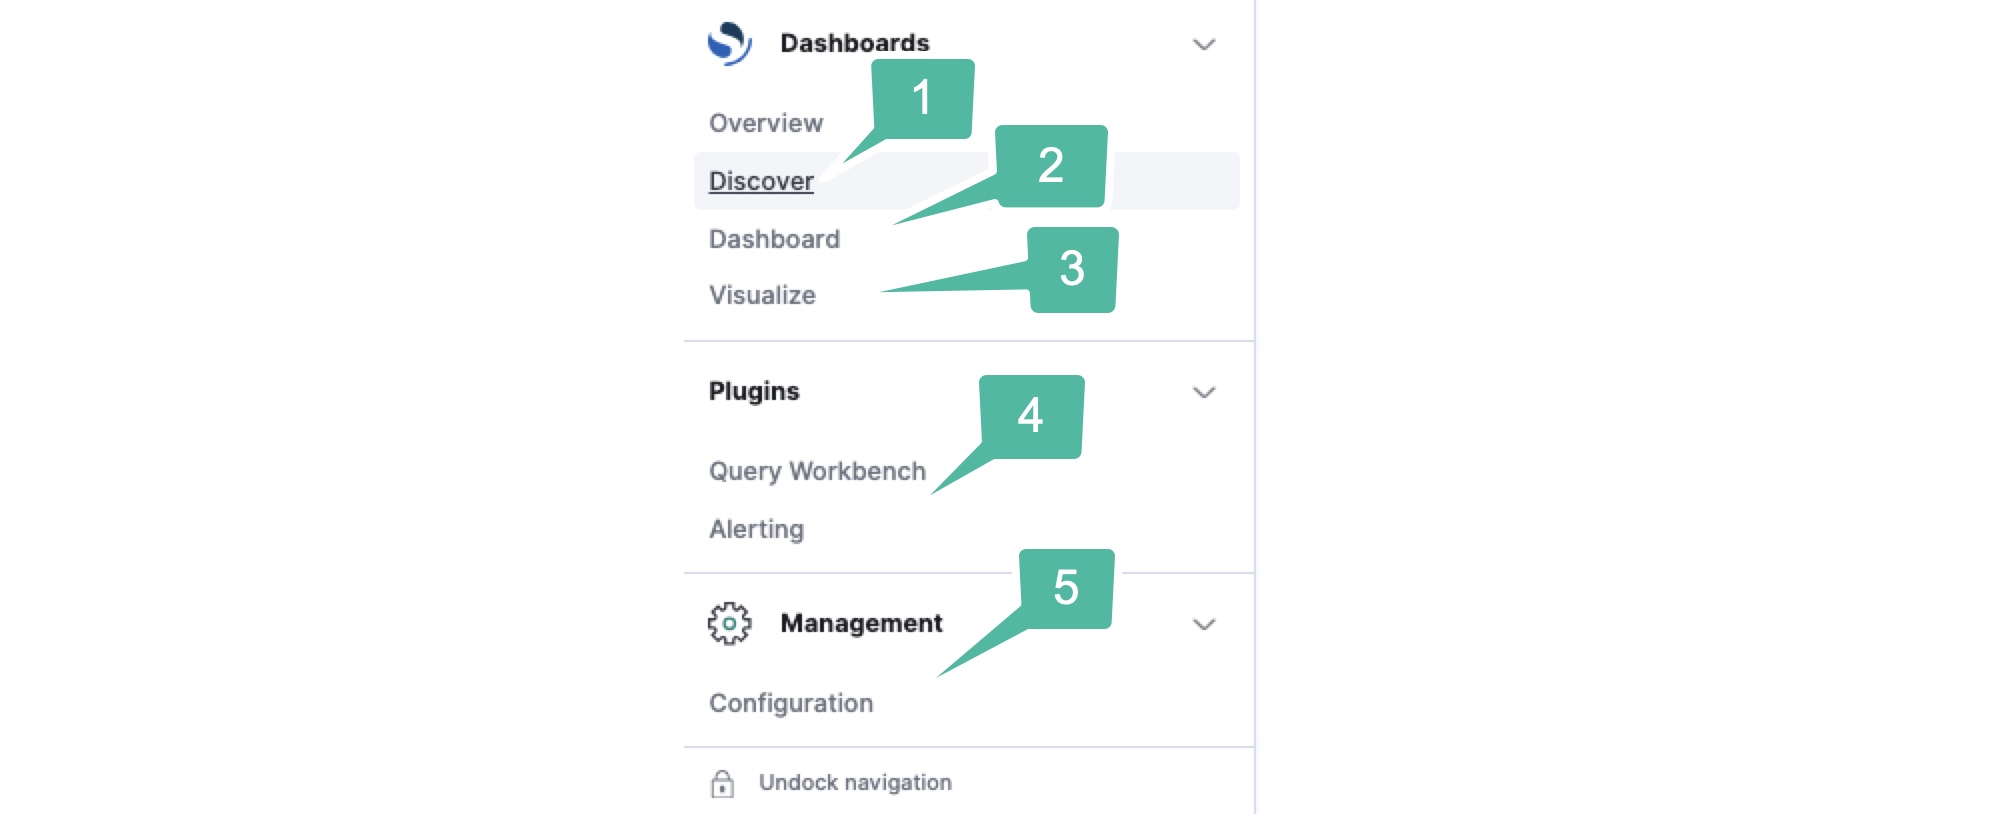
The Search Analytics left menu offers a variety of options. Note that your account might not have permission to see all of these options.
-
Discover – to perform searches of the data for a view. This is the default starting page.
-
Dashboard – an area of preconfigured, multi-chart pages that provide a side-by-side display of one or more visualizations.
-
Visualize – an editor for graphical representations of data from a view or a saved Discover search. You can display data in tabular or graphical layouts like pie, line, area, or bar charts.
-
Plugins – contains links to the Query Workbench, where you can drill-down to the SQL Analytics features to query using those methods, and to Alerting which enables users to create monitors (defined patterns of conditions to watch for) that can raise alerts when conditions are detected. Alerts for the system are displayed on this page and can be reviewed and acted upon by service team members at your site.
-
Management – links to a Configuration page where you can access the list of saved objects such as views (i.e., index patterns), visualizations, dashboards, and searches. You can search the list for objects, import and export objects, as well as access to some advanced settings that control Search Analytics behaviors, such as the number of hits/records to return in the Discover results.
Most users begin by using the Discover page to search available views for information. Some users might begin with pre-built dashboards or visualizations to see curated information and visualizations about their log and event files. These pre-built dashboards and visualizations might have been created by analytics at their site, or by ChaosSearch Customer Success team members.
In this section:
Searching the indexed data
Creating visualizations
Building a dashboard
Dashboard & Visualization Migration
Updated about 1 year ago