Create Grafana Data Links to Drill-Down to ChaosSearch
Configure hotspots within Grafana panels and dashboards to drill-down to ChaosSearch features.
Grafana supports the ability to configure hotspots within its panels and dashboards to enable easy drill-downs to other Grafana dashboards or to external URLs.
Grafana users can follow dashboard links to drill-down to another Grafana dashboard. With external links, Grafana users can drill down to the ChaosSearch Discover to run a more extensive search with wildcards or other filters for the same time range as the Grafana dashboard, to the SQL Editor for querying, or for a closer look at a ChaosSearch dashboard or visualization to review possible contributing factors or history that might have contributed to a metric's value or a problem condition.
Dashboard Links
Sample dashboard links to three ChaosSearch features are shown in the following dashboard, where the configured links appear in the top-right corner of the dashboard.

To add or modify dashboard links:
- Click the Dashboard settings (gear) icon at the top of the dashboard to display the Settings page, then click Links on the left menu.

- Click New link. The Dashboard links > Edit page for a new link appears.

- Specify the following information:
- Type a new link name in the Title field.
- Select Link in the Type field to create an external link to ChaosSearch.
- For the URL, type or paste in the URL to the target page such as the Discover page or other. The dashboard link below is an example that uses variables to pass the time range of the Grafana dashboard and the view name as input to the URL. (See the later section ChaosSearch Data Link URL Hints for more information.)
https://mycustomer.chaossearch.io/#/analytics?pathname=%252Fkibana%252Fapp%252Fdiscover&kibana=%2523%252F%253F_g%253D(filters%253A!()%252Cquery%253A(language%253Akuery%252Cquery%253A%252527%252527)%252CrefreshInterval%253A(pause%253A!t%252Cvalue%253A0)%252Ctime%253A(from%253A%252527${__from:date:iso}%252527%252Cto%253A%252527${__to:date:iso}%252527))%2526_a%253D(columns%253A!(_source)%252Cfilters%253A!()%252Cindex%253Asample-elb-view%252Cinterval%253Aauto%252Cquery%253A(language%253Akuery%252Cquery%253A%252527%252527)%252Csort%253A!())- In the Tooltip field, type a short pop-up text message that appears when users hover over the link in the dashboard.
- Click Apply to save the link, and save the dashboard for the link updates.
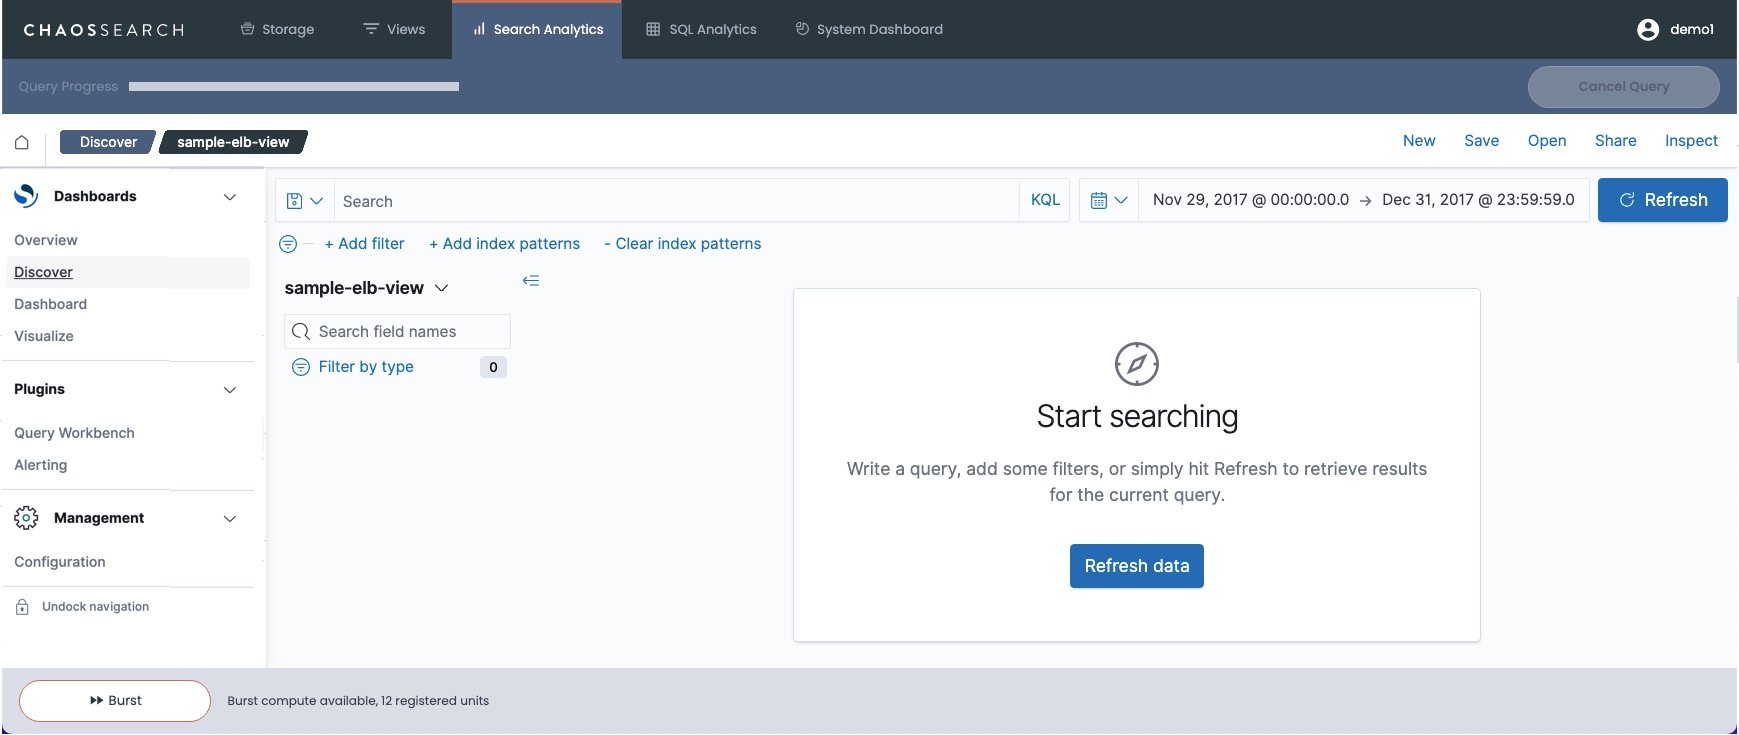
The next time you display the dashboard, the link appears in the top right corner of the dashboard as in the sample dashboard panel above. In this example, clicking the link opens a new browser tab to launch the ChaosSearch Discover feature for the same timeframe as the Grafana dashboard.
Panel Links
You can also create drill-down links within a Grafana panel of a dashboard. The panel links can also drill down to another Grafana dashboard or to ChaosSearch features. For example, the following screen shows a data link definition to open a ChaosSearch Discover session for the view and timeframe:

To add a link in a panel, when you create or edit a panel, look for the Data links section in the right panel definition menu. You can add one or more links to the panel.
Review the Grafana documentation for creating data links for more information about the feature and how to embed variables to pass time ranges, filters, and other settings as part of the URL definition.
ChaosSearch Data Link URL Hints
When you create external links in your Grafana dashboards and panels, links to ChaosSearch require you to construct the URL to that target drill-down location. As you plan your links to ChaosSearch, it can help to test on your ChaosSearch environment to find the correct URL to the Discover UI or other targets.
For example, the following URL opens a Discover window with a default time range of the last 15 minutes and for a view sample-json-view, both of those values shown in bold in the syntax below. (Note that the https:// is omitted from the beginning of the sample line to prevent the help system from activating the hyperlink.)
mycompany.chaossearch.io/#/analytics?pathname=%252Fkibana%252Fapp%252Fdiscover&kibana=%2523%252F%253F_g%253D(filters%253A!()%252CrefreshInterval%253A(pause%253A!t%252Cvalue%253A0)%252Ctime%253A
(from%253Anow-15m%252Cto%253Anow))
%2526_a%253D(columns%253A!(_source)%252Cfilters%253A!()%252Cindex%253A
sample-json-view
%252Cinterval%253Aauto%252Cquery%253A(language%253Akuery%252Cquery%253A'')%252Csort%253A!())
The data link URLs can be a little complex to read and edit. Make sure that the URL has the correct ChaosSearch domain, and the correct path to the target like Discover or a dashboard. When you want to pass the time range of the Grafana dashboard to the URL, you can use the time variable string similar to:
(from%253A%252527${__from:date:iso}%252527%252Cto%253A%252527${__to:date:iso}%252527)
As a complete example:
https://mycompany.chaossearch.io/#/analytics?pathname=%252Fkibana%252Fapp%252Fdiscover&kibana=%2523%252F%253F_g%253D(filters%253A!()%252Cquery%253A(language%253Akuery%252Cquery%253A%252527%252527)%252CrefreshInterval%253A(pause%253A!t%252Cvalue%253A0)%252Ctime%253A(from%253A%252527${__from:date:iso}%252527%252Cto%253A%252527${__to:date:iso}%252527))%2526_a%253D(columns%253A!(_source)%252Cfilters%253A!()%252Cindex%253Asample-elb-view%252Cinterval%253Aauto%252Cquery%253A(language%253Akuery%252Cquery%253A%252527%252527)%252Csort%253A!())
Linking to SQL Analytics
The following URL is a simple target to open ChaosSearch SQL Analytics, where users could then navigate to SQL Editor or canned dashboards.
https://mycompany.chaossearch.io/#/sqlLinking to a Specific OpenSearch Dashboard
As in the Discover link, you can pass the time range variable to display the ChaosSearch dashboard for the same range as the Grafana dashboard. Make sure that you have the correct ChaosSearch dashboard unique ID, it helps to display the ChaosSearch dashboard and then copy the URL from the Browser window to get the information to paste into the URL.
https://mycompany.chaossearch.io/#/analytics?pathname=%252Fkibana%252Fapp%252Fdashboards&kibana=%2523%252Fview%252F3782d061-3485-4f96-8c5c-4aab8bd658c2%253F_g%253D(filters%253A!()%252CrefreshInterval%253A(pause%253A!t%252Cvalue%253A0)%252Ctime%253A(from%253A%252527${__from:date:iso}%252527%252Cto%253A%252527${__to:date:iso}%252527))%2526_a%253D(description%253A''%252Cfilters%253A!()%252CfullScreenMode%253A!f%252Coptions%253A(hidePanelTitles%253A!f%252CuseMargins%253A!t)%252Cquery%253A(language%253Akuery%252Cquery%253A'')%252CtimeRestore%253A!t%252Ctitle%253A'AWS%252520ELB%252520Dash'%252CviewMode%253Aview)
Updated about 1 year ago