Get Started with SQL Analytics
How to use the embedded Superset to run SQL queries and create visualizations using your Refinery views
The SQL Analytics tab of the ChaosSearch console is a portal to an embedded version of Apache Superset, where you can use SQL statements to query Refinery views, and to create charts and dashboards for analysis and visualization of your indexed data.
To get started, click the SQL Analytics tab. The Home page appears:
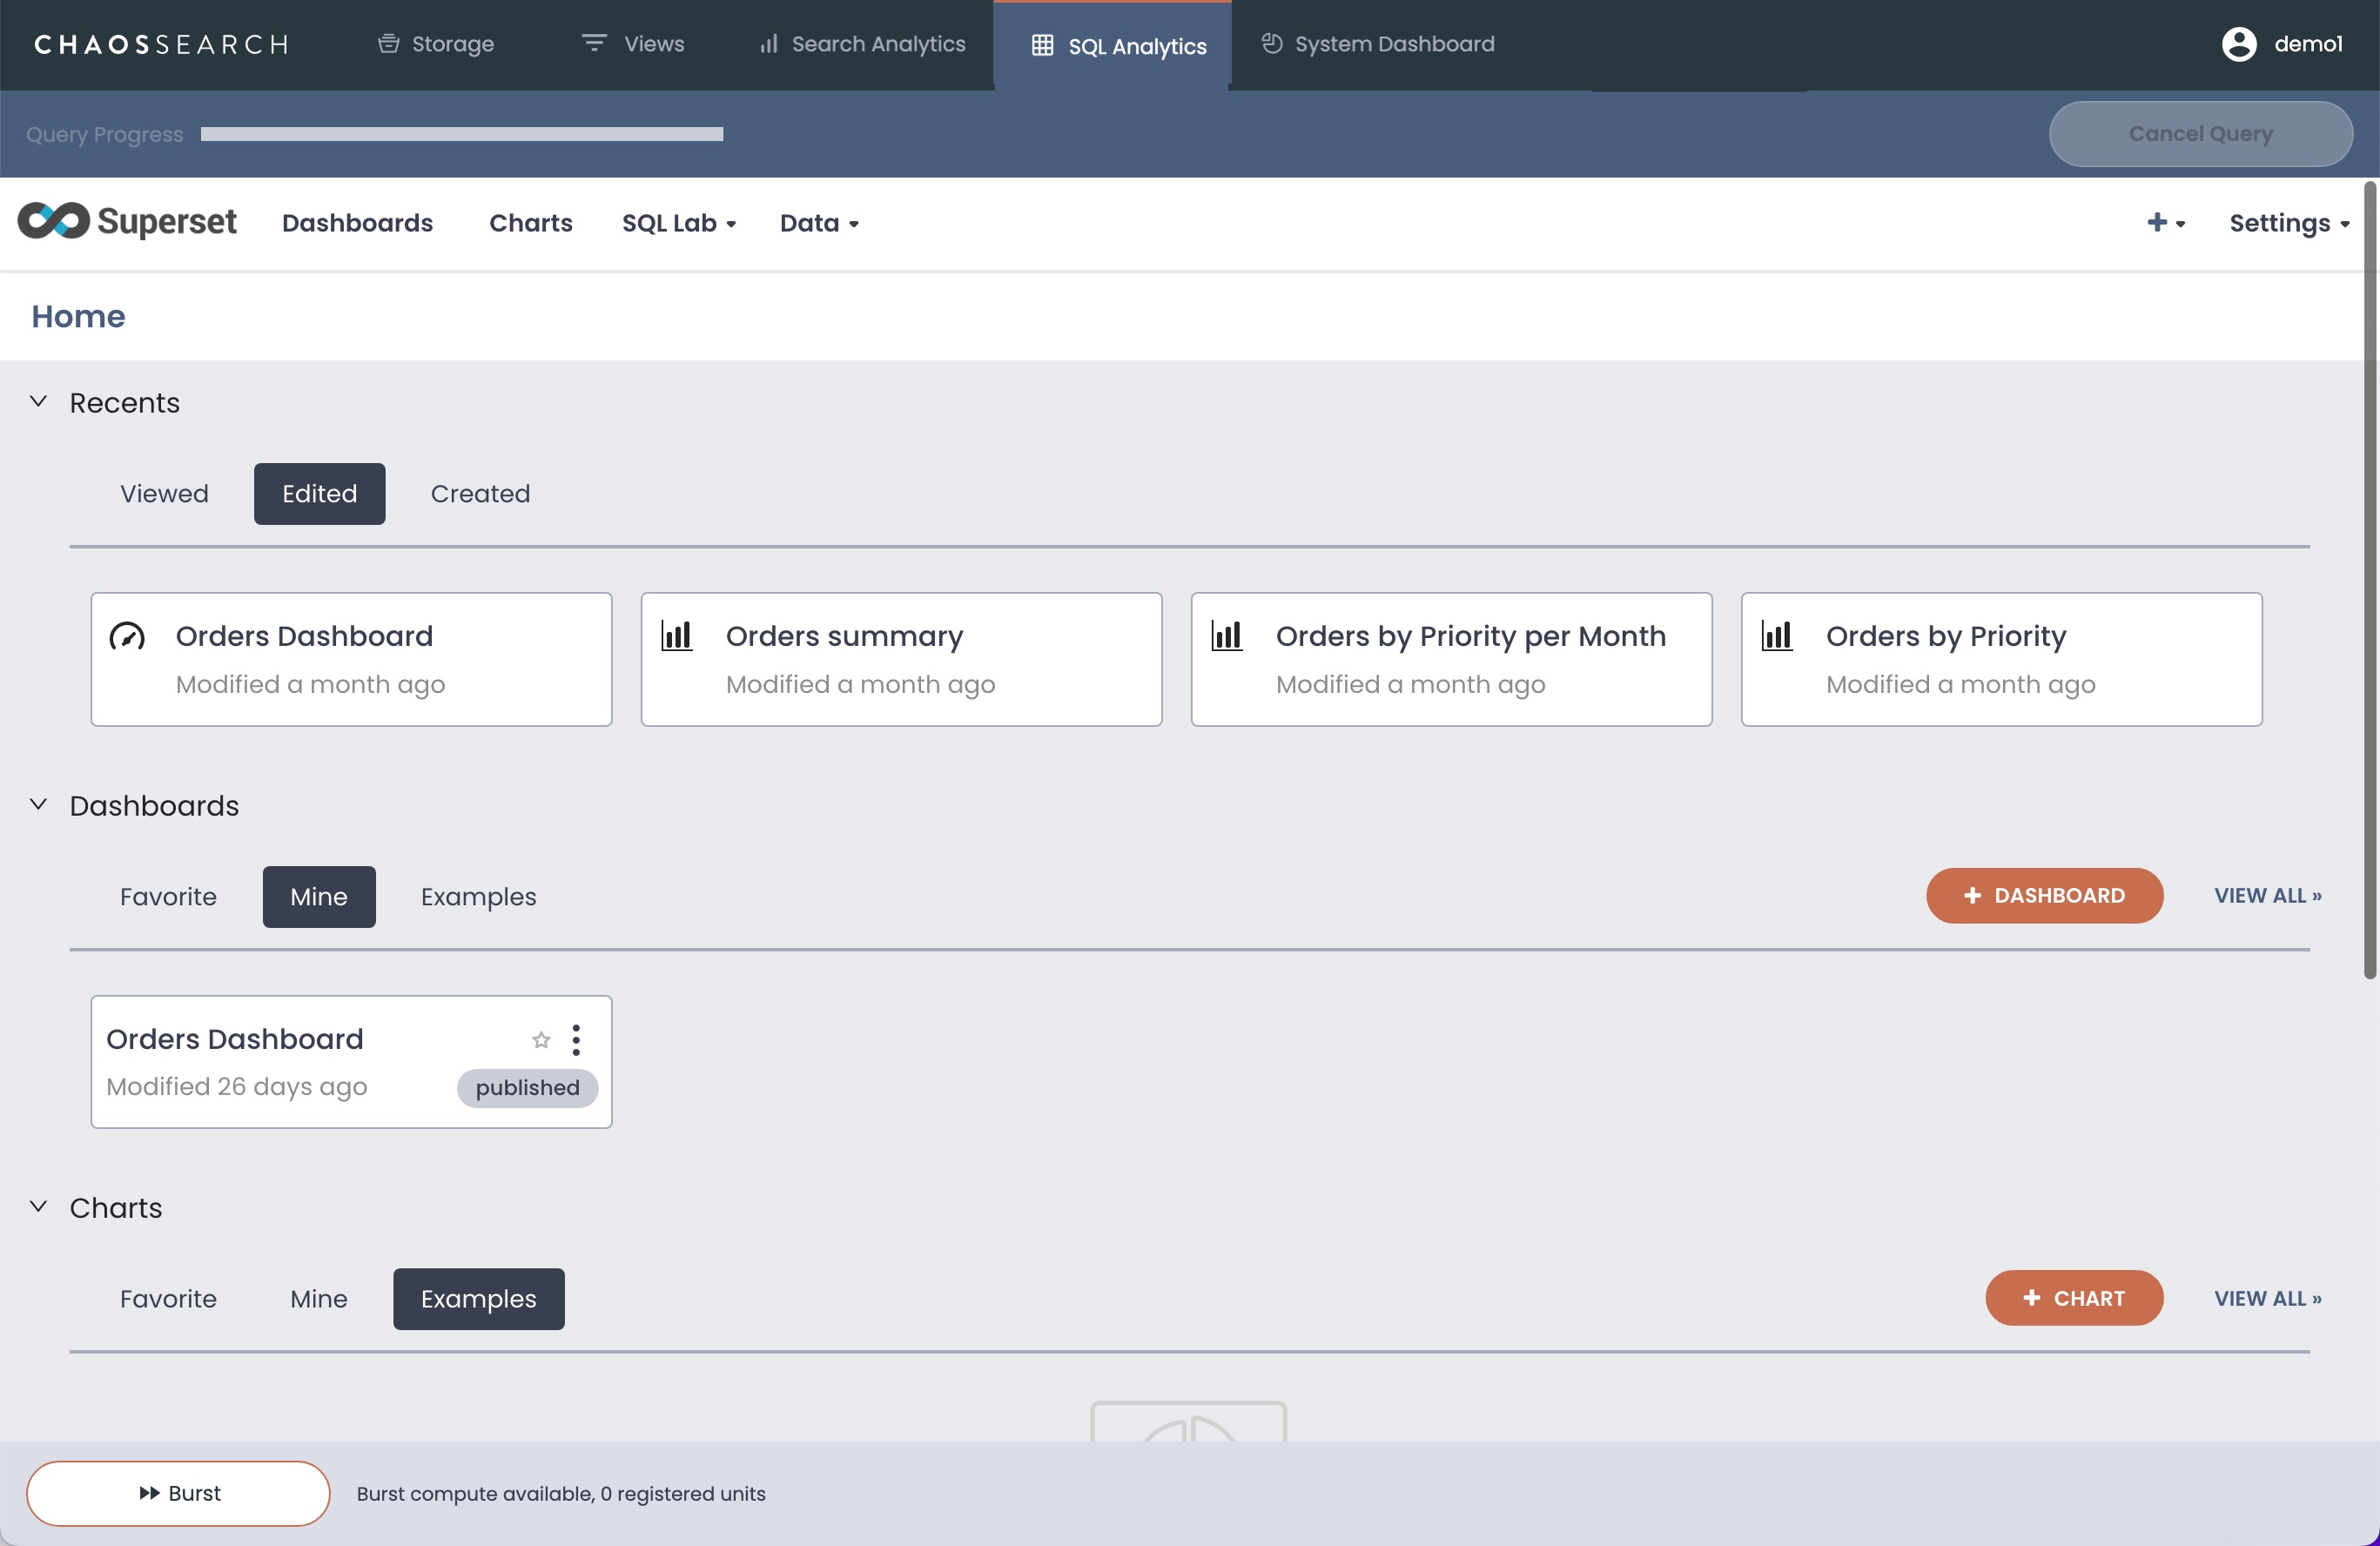
The Home page lists any queries, dashboards, or charts that you can use to explore or visualize the data in ChaosSearch. The page is typically empty for new environments. As you create queries and save, charts, and dashboards, more entries will be visible on the page. More information about using the Superset features is available later in this help section, such as Adding Datasets and Create a Chart.
You might also find predefined content if ChaosSearch Customer Success teams or business analysts at your site created some canned charts, dashboards, or saved queries for your account to use. Any components that you are granted permission to use will also be visible on the Home page. Certified dashboards and charts have a check mark with more information about their purpose.
Have some predefined Superset content?If you are new to Superset, a great way to begin is to use one of the available home page charts, dashboards, or saved queries. Or, if you are starting from a new Home page, use the SQL Lab and Run a SQL Query to examine your Refinery views and indexed data.
Updated about 1 year ago