OpenSearch Dashboards Metric and Bucket Aggregations
A list of the supported metric and bucket aggregations for use in visualizations
This page lists the supported metric and bucket aggregations that can be used when creating aggregations for visualizations in OpenSearch Dashboards.
Supported Metric Aggregations
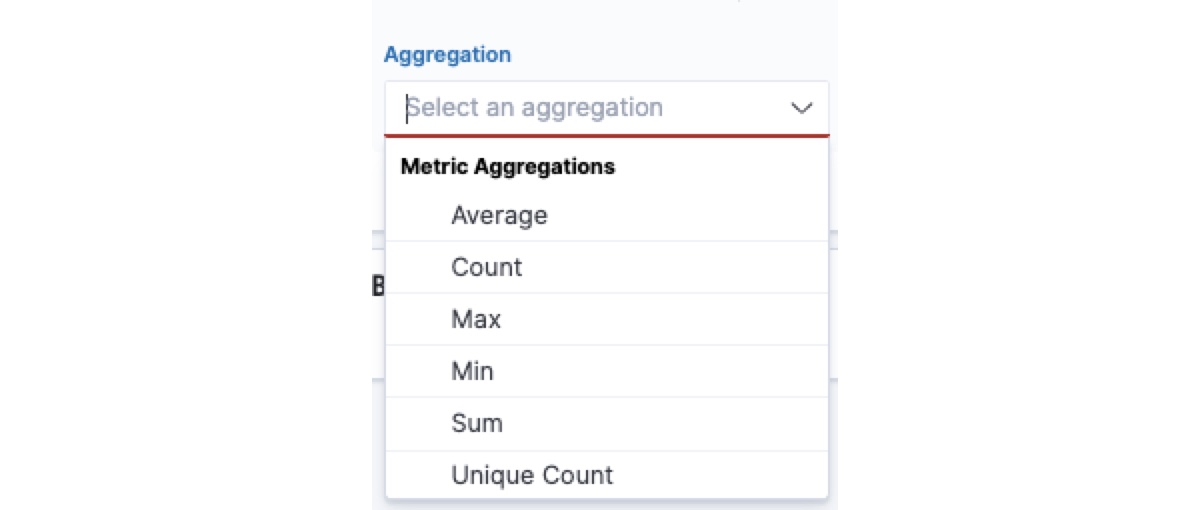
ChaosSearch users can build visualizations and dashboards that summarize data using the following metric aggregations:

| Metric Aggregation | Supported | Description |
|---|---|---|
| Average | Yes | This aggregation returns the average of a numeric field. Select a field from the drop-down list. |
| Count | Yes | The count aggregation returns a raw count of the elements in the selected view. |
| Max | Yes | The max aggregation returns the maximum value of a numeric field. Select a field from the drop-down list. |
| Min | Yes | The min aggregation returns the minimum value of a numeric field. Select a field from the drop-down list. |
| Percentiles | Yes | The percentiles aggregation returns the values for a range of percentiles. The default is [1, 5, 25, 50, 75, 95, 99], or you can specify a custom set of percentiles values in the range of 0 to 100. |
| Sum | Yes | The sum aggregation returns the total sum of a numeric field. Select a field from the drop-down list. |
| Unique Count | Yes | The unique count (cardinality) aggregation returns the number of unique values in a field. Select a field from the drop-down list. |
Supported Bucket Aggregations
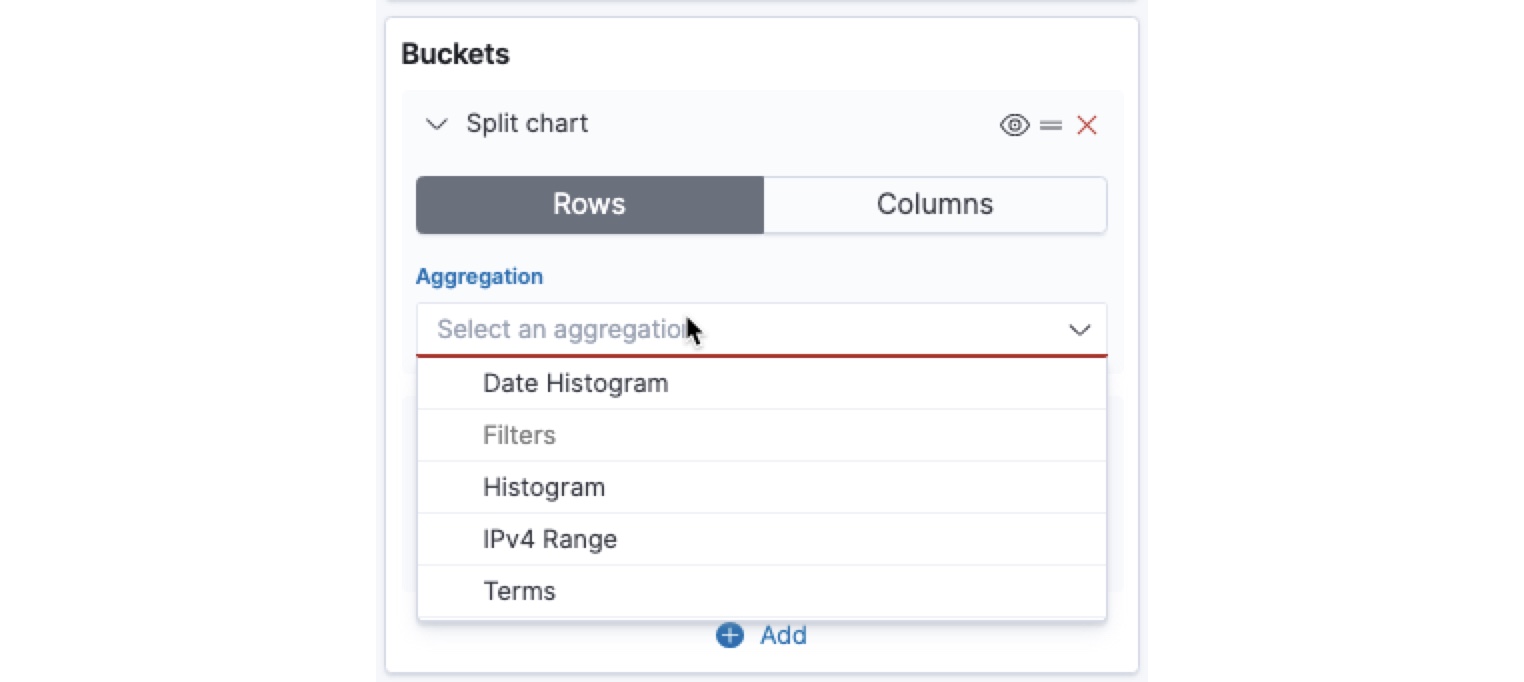
ChaosSearch users can build visualizations and dashboards that summarize data using the following bucket aggregations. Note that different bucket types are supported for each visualization type. After you select the visualization type, the available bucket aggregations are displayed in the Aggregation menu. This image represents only a partial list, specifically the types supported for tables.

Aggregation | Supported | Description |
|---|---|---|
Date Histogram | Yes | A date histogram is built from a numeric field and organized by date. You can specify a time frame for the intervals in seconds, minutes, hours, days, weeks, months, or years. You can also specify a custom interval frame by selecting Custom as the interval and specifying a number and a time unit in the text field. Custom interval time units are s for seconds, m for minutes, h for hours, d for days, w for weeks, and y for years. Different units support different levels of precision, down to one second. Intervals are labeled at the start of the interval, using the date-key returned by Elasticsearch. For example, the tooltip for a monthly interval will show the first day of the month. |
Date Range | Yes | A date range aggregation reports values that are within a range of dates that you specify. You can specify the ranges for the dates using date math expressions. Click Add Range to add a set of range endpoints. Click the red bucket symbol to remove a range. |
Filters | Yes | A filters aggregation is a DQL query clause, exactly like a search query — match or term or range. You can use the Filters aggregation to narrow down the results to the specified query. Note that nested JSON queries are not supported in Filters aggregations. |
Histogram | Yes | A standard histogram is used to visualize the distributions of values in a number column, based on a specified interval. Select a number field for the histogram, and specify an integer value for the interval to use. Optionally, you can select the Show empty buckets checkbox to include empty distribution buckets in the histogram, and use Extend bounds to specify a wider range of values to show on the distribution axis. |
IPv4 Range | Yes | The IPv4 range aggregation enables you to specify ranges of IPv4 addresses. This aggregation applies only to view columns that use the Treat as IP materialization. Click Add Range to add a set of range endpoints. Click the red bucket symbol to remove a range. |
Range | Yes | The range aggregation enables the user to define a set of ranges, where each range represents a separate bucket. During the aggregation process, the values extracted from each document (matching index record) are compared to each bucket range and the matching records are included in the relevant/matching range. Note that nested JSON queries are not supported in Range aggregations. |
Terms | Yes | A terms aggregation enables you to specify the top or bottom n elements of a given field to display, ordered by count or a custom metric. |
Sub-buckets | Yes | After you define a bucket type aggregation, you can define sub-buckets to refine the visualization. Click + Add sub-buckets to define a sub-bucket, then choose Split Rows or Split Table, then select an aggregation from the list of types. |
Updated 12 months ago
