NGINX Visualizations
User agent and status code visualizations can help to show processing activity and web server insights.

NGINX is open source software for web serving, reverse proxying, caching, load balancing, media streaming, and more. It started out as a web server designed for maximum performance and stability. In addition to its HTTP server capabilities, NGINX can also function as a proxy server for email (IMAP, POP3, and SMTP) and a reverse proxy and load balancer for HTTP, TCP, and UDP servers.
ChaosSearch offers some examples of pre-built dashboards and visualizations with the relevant fields needed to create visualizations for NGINX. The following examples show a sample dashboard with the pre-built visualizations that our team has created to visualize the data from these services.
Sample dashboard NDJSON files are available.Contact your ChaosSearch Customer Success representative if you would like a copy of the NDJSON file used to build the sample dashboard below. You can import the NDJSON file to try it with one of your NGINX views.
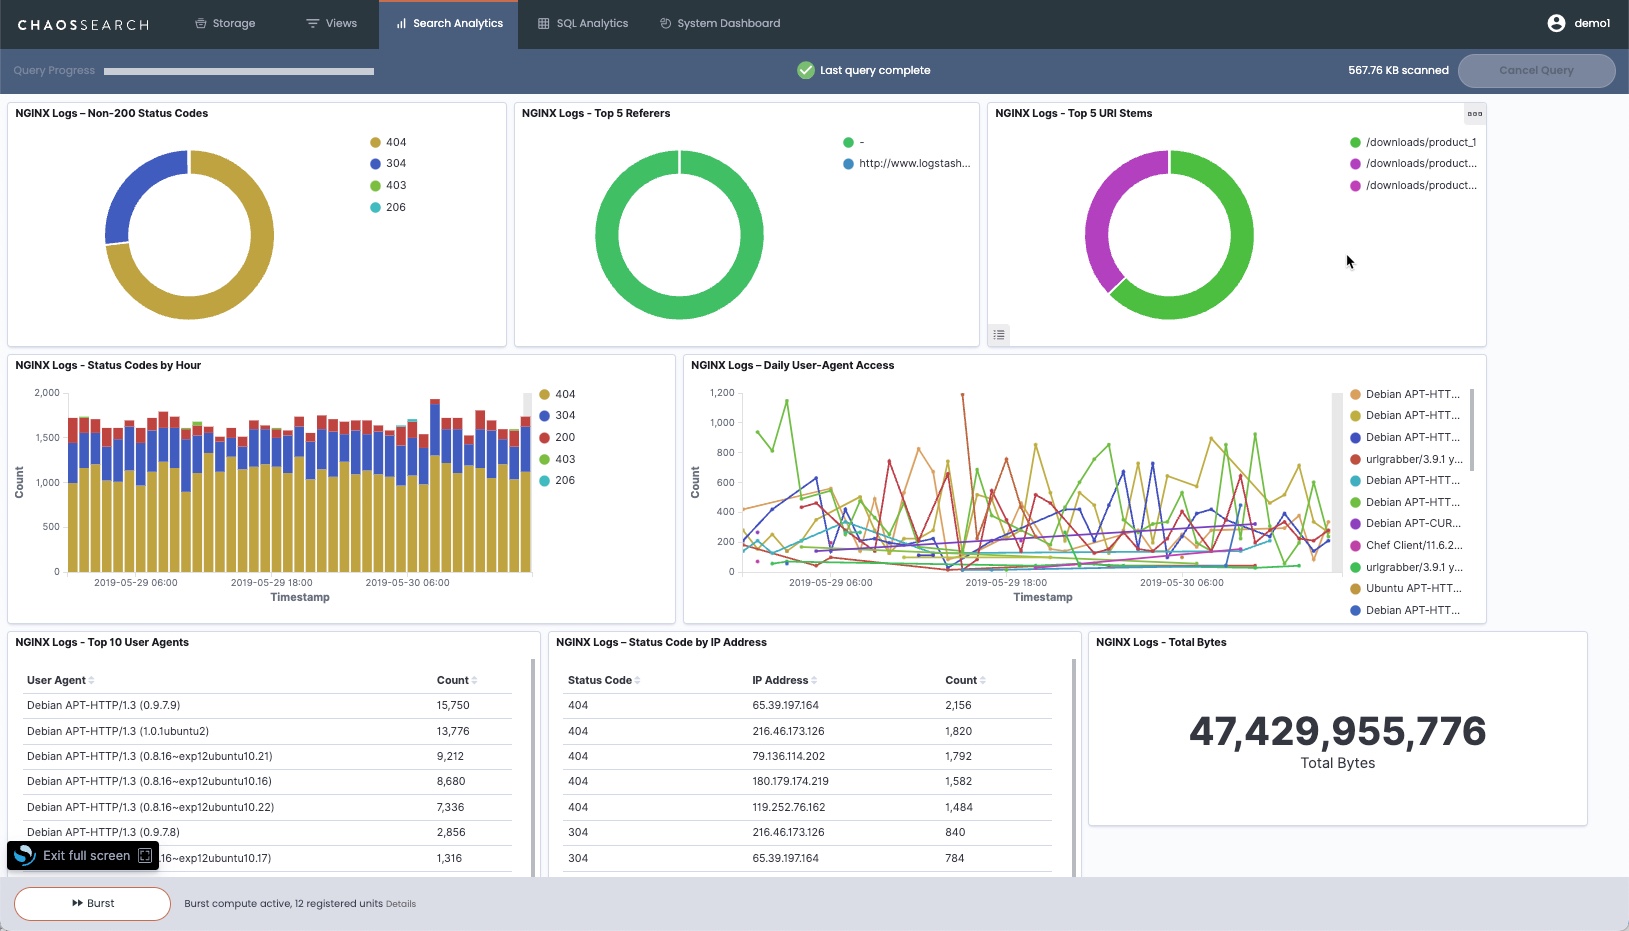
NGINX Sample Dashboard
Updated about 1 year ago