Create an Annotation
Annotations add meaningful messages to charts to help with the user interpretation of the data
An annotation layer is a named set of different annotations for charts. One layer can be used as a container for different annotations. This topic describes how to create annotation layers and annotations.
Add an Annotation Layer
To create an annotation layer:
-
Go to SQL Analytics > Settings > Annotation Layers to open the Annotation layers window.
-
Click + Annotation Layer. The Add annotation layer window appears.

- Type a name for the layer.
- Optionally, type a description for the layer.
- Click Add.
Add an Annotation
You can define annotations in an existing annotation layer.
To add an annotation:
-
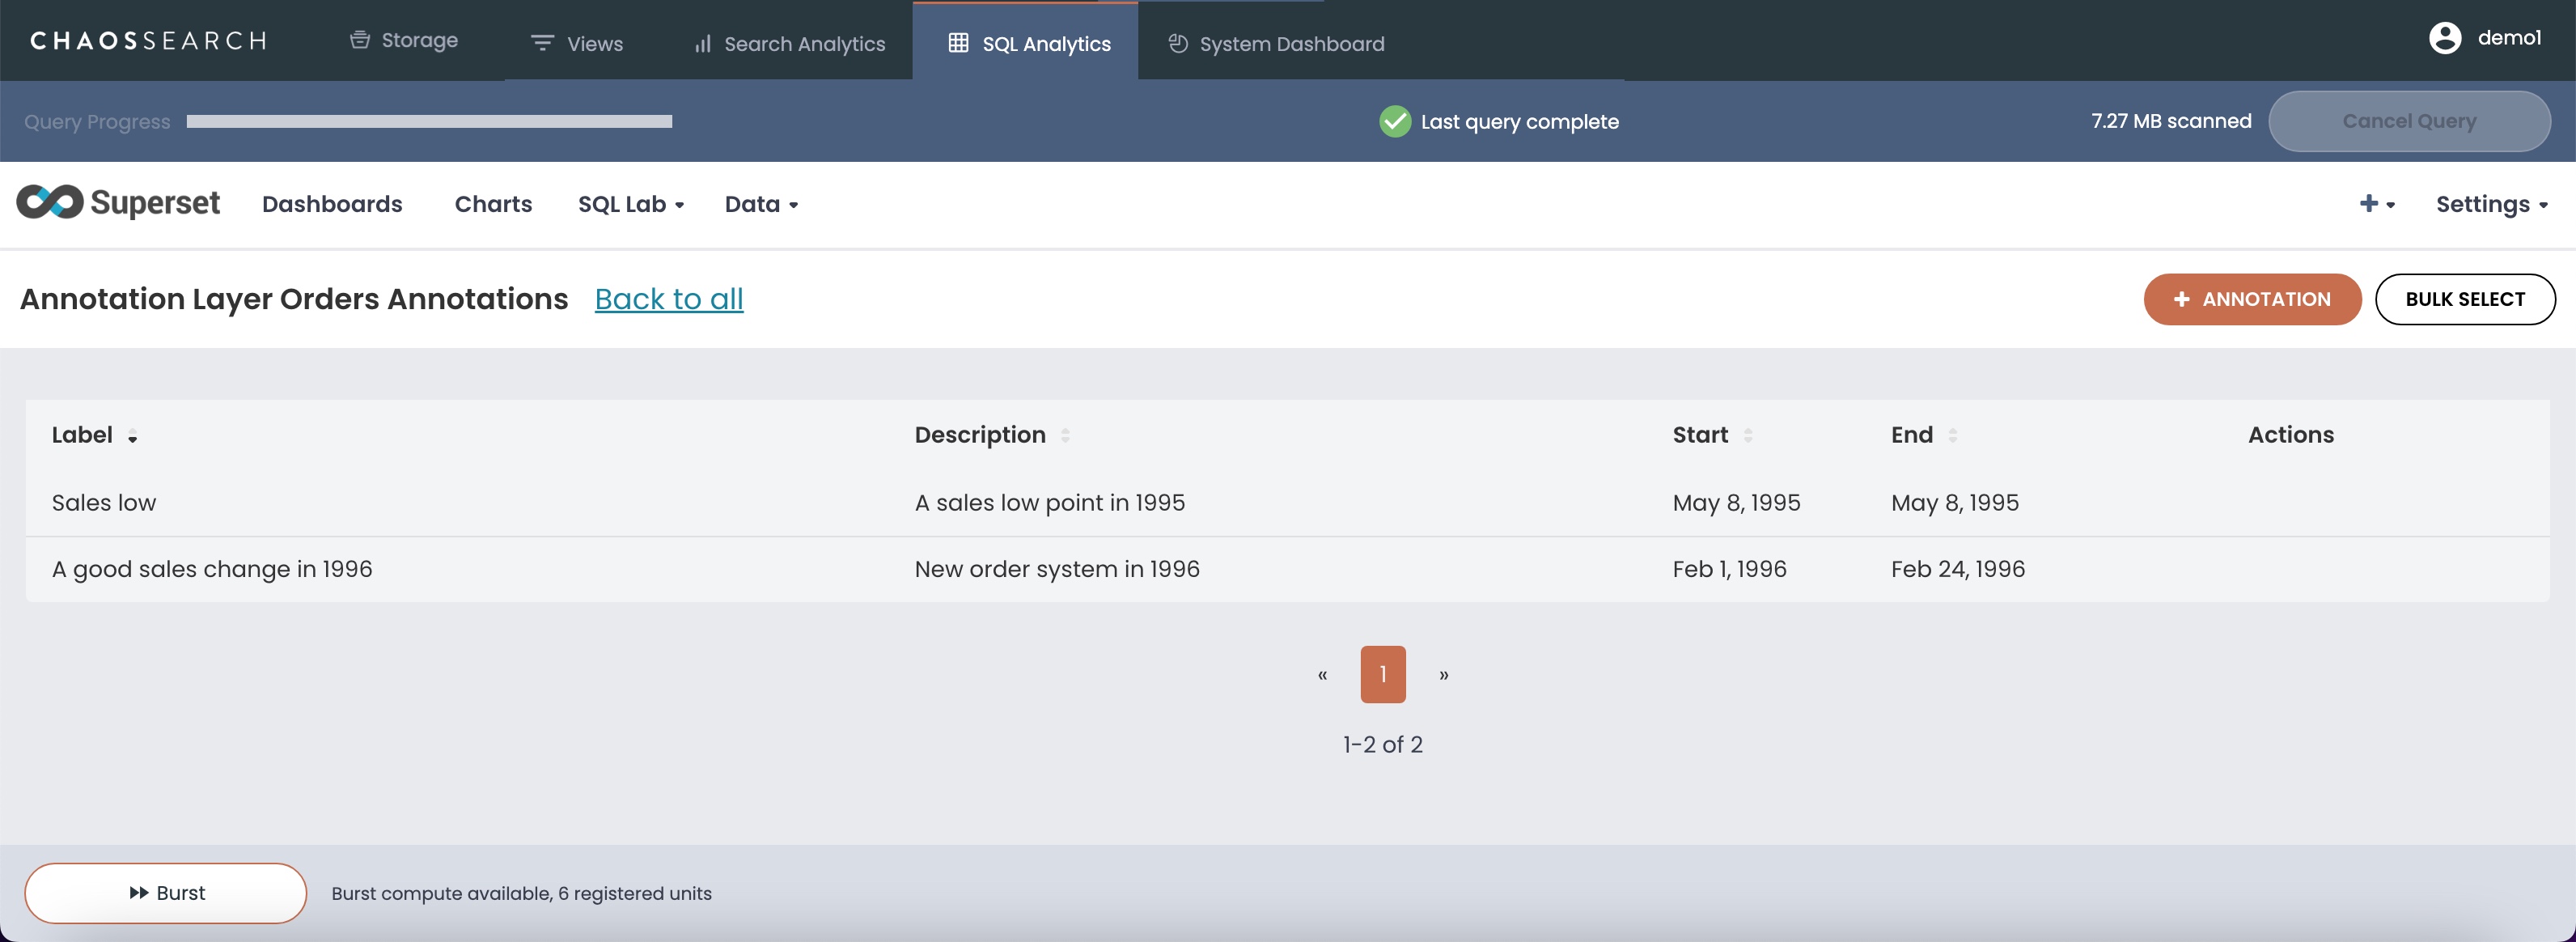
On the Annotation layers page, select the annotation layer in which you want to add an annotation. The detailed page for the layer appears.
-
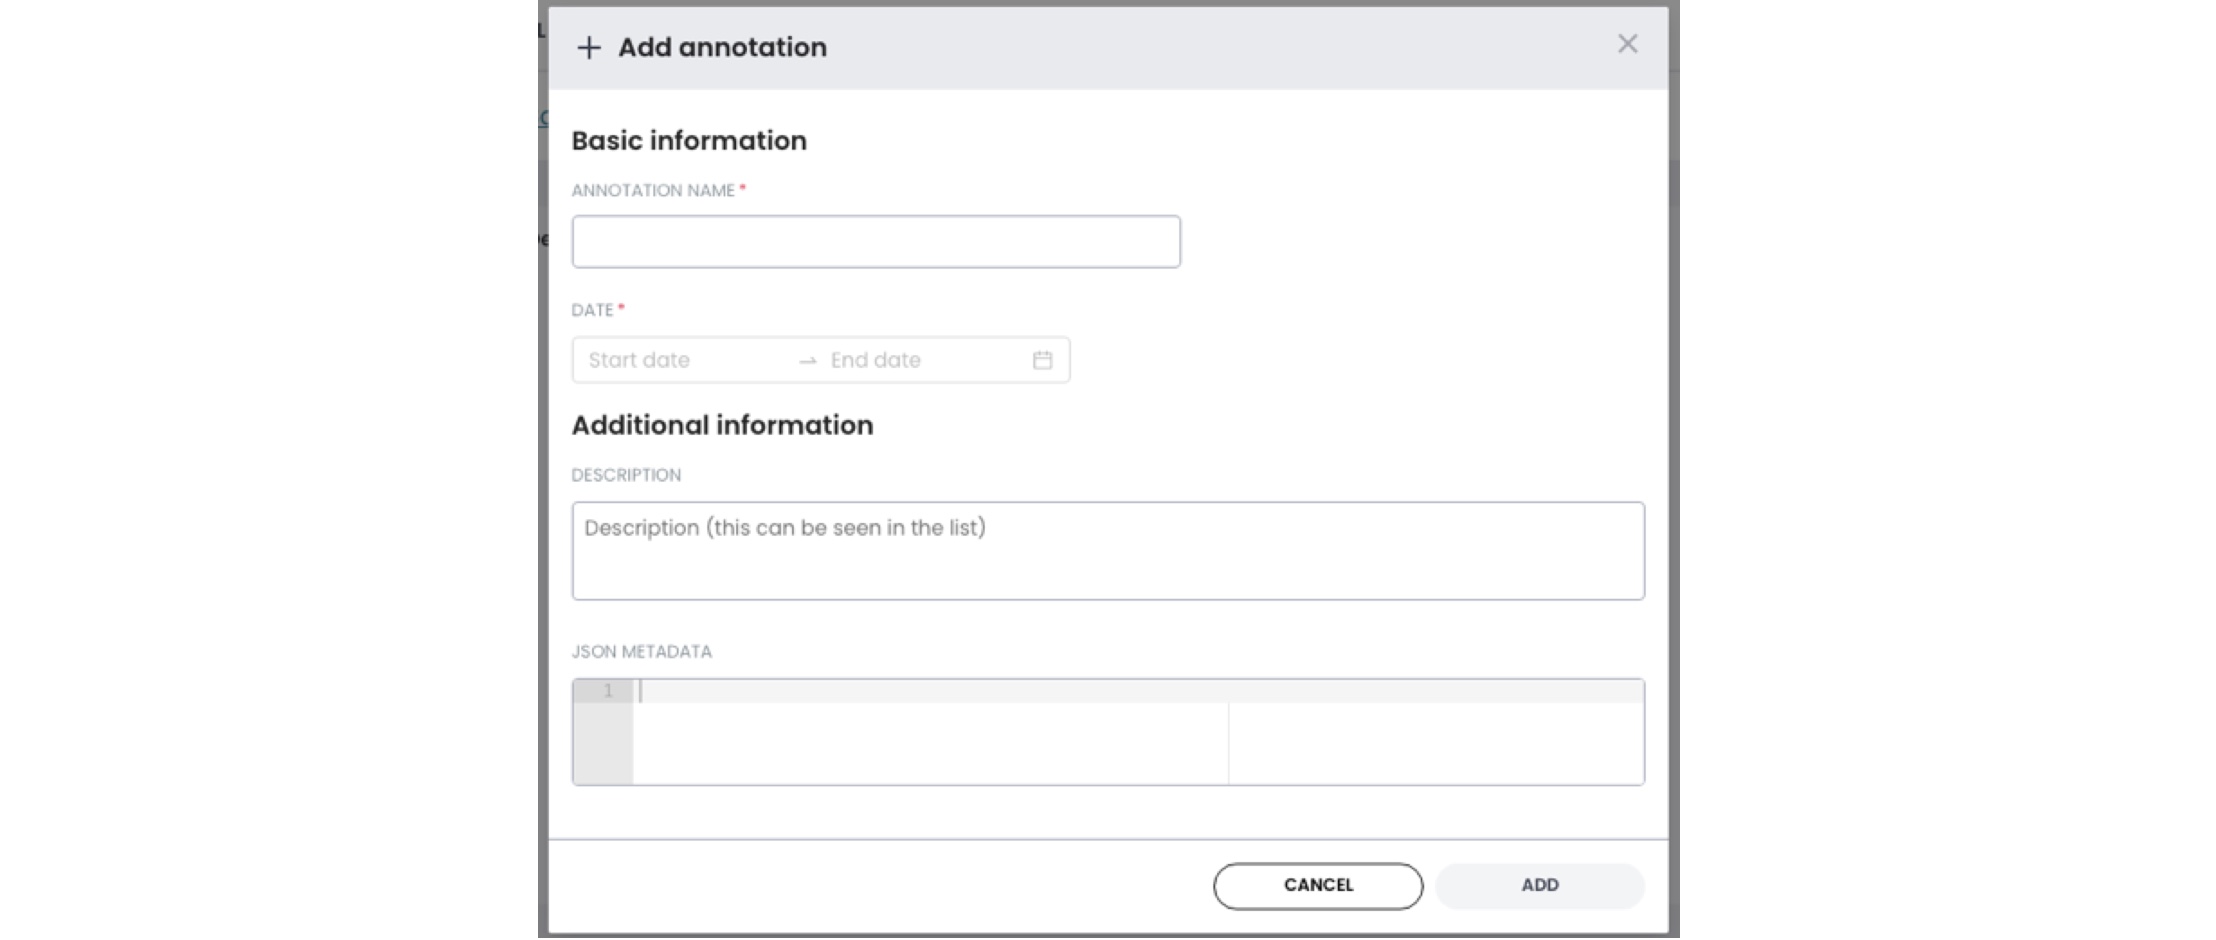
Create a new annotation by clicking + Annotation. The Add annotation window appears.
-
Type a unique name for the annotation.
-
Use the calendar selector to specify a date range with a start and end date (year, day, time) combination for the annotation.
Events and IntervalsIn Superset, there is a concept of an event annotation and an interval annotation. Events and intervals are essentially the same definition, but the start and and day value for an event is the same day (for example, June 1 to June 1. For an interval the days are different, June 1 to June 2.
-
Type a description for the annotation if desired.
-
Type JSON metadata for the annotation if desired.
-
Click Add. The annotation is added to the layer.
Updated about 1 year ago