Sample Grafana Dashboards with ChaosSearch Log Data
Create panels of ChaosSearch Index data to enrich Grafana dashboards
Using an Elasticsearch data source created for a ChaosSearch view, you can add panels of ChaosSearch indexed data to Grafana dashboard to add more information or supporting details to that observation pane.
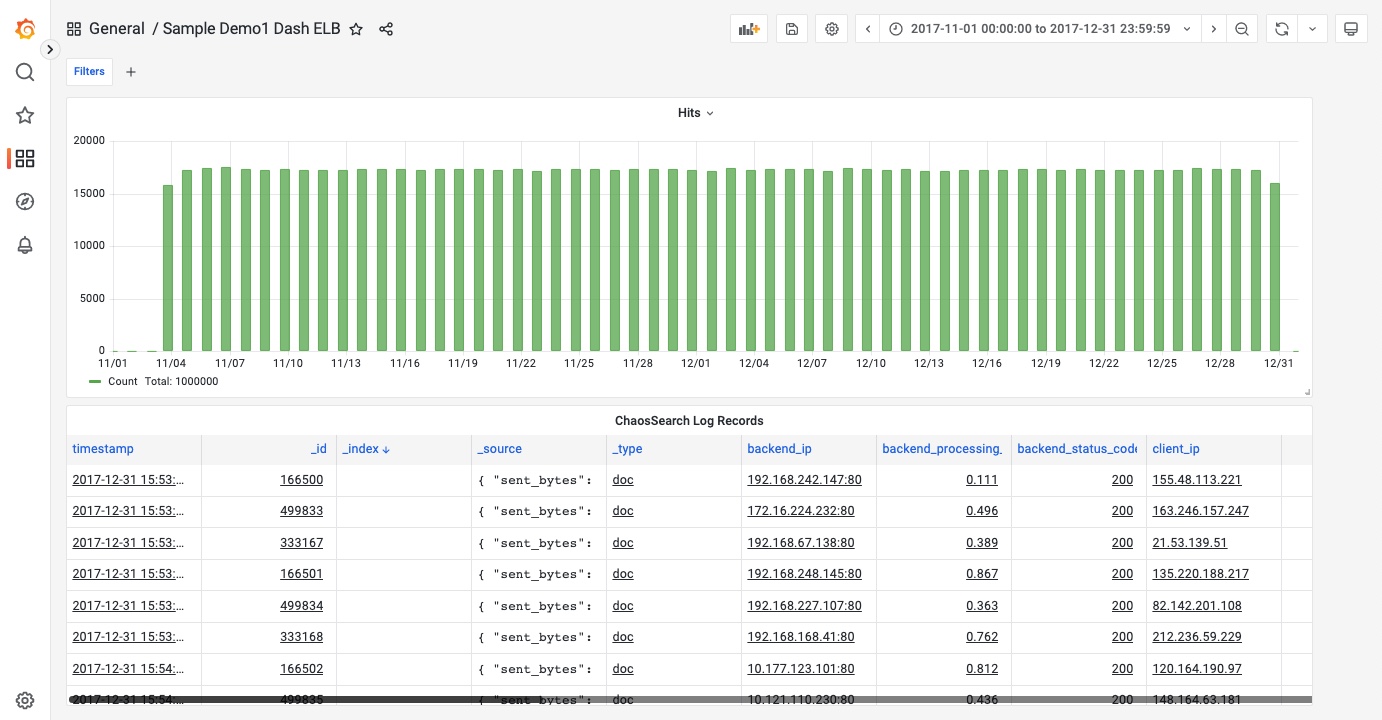
A common information display is to add a panel of log records, similar to the Discover search results in OpenSearch Dashboards. For example, the following two Grafana panels are similar to the Discover search results. This content can be helpful for a Grafana dashboard to provide more information about related events for the Grafana dashboard time range:

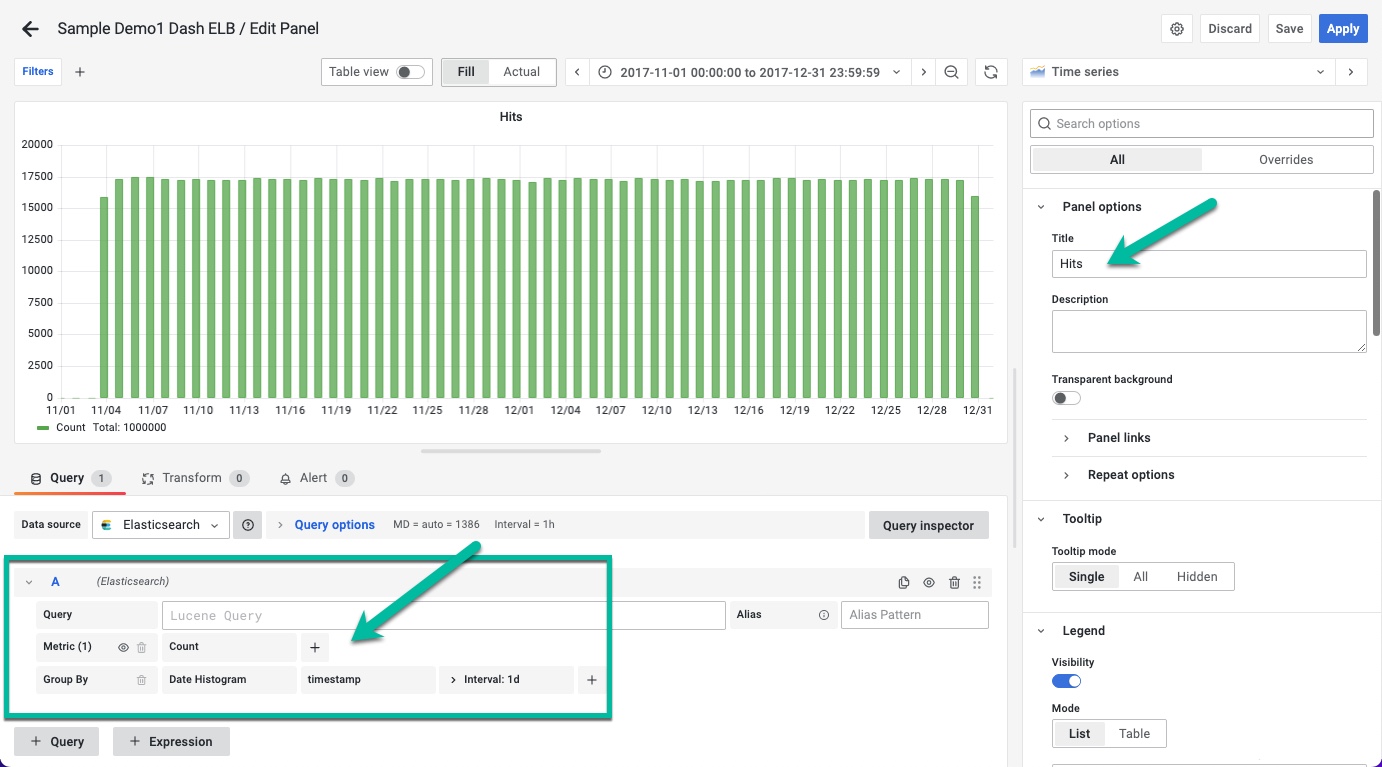
The top panel is a Date Histogram that uses count to measure the records observed on a daily interval basis:

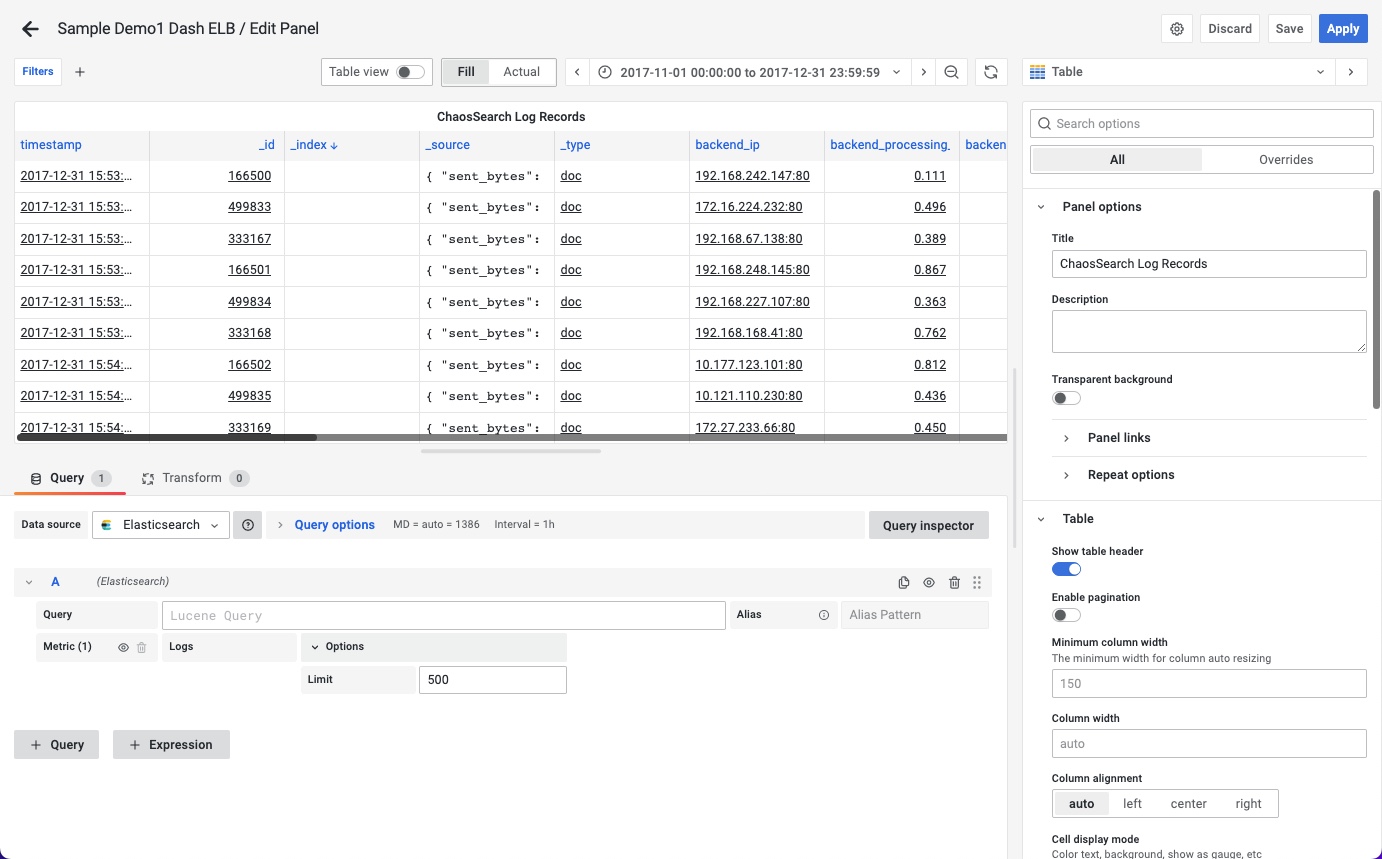
The bottom panel uses the Logs metric type with a limit of 500 to show more detailed log records, similar to the Discover detailed records display:

You can use the Grafana tools to customize the displays as needed. But for more extensive investigation and searching, use the data links features to create hotspots to drill-down to the ChaosSearch tools directly.
Updated 12 months ago
Enhance your Grafana dashboards and panels with hyperlinks to powerful ChaosSearch Discover and wildcard search features.
