Saving and Deleting Visualizations
Save and delete visualizations in the Search Analytics page
Saving a visualization of interest allows permitted users to open and use the visualization to see the same summary for a different time range. This can be helpful for detecting trends or changes in patterns, or changes in overall totals.
Saving a Visualization
You can save a visualization to create a named template that you can open and review later for new time ranges, or to use as a panel in a dashboard.
To save a visualization:
- In the top right corner of the Visualize page, click Save.
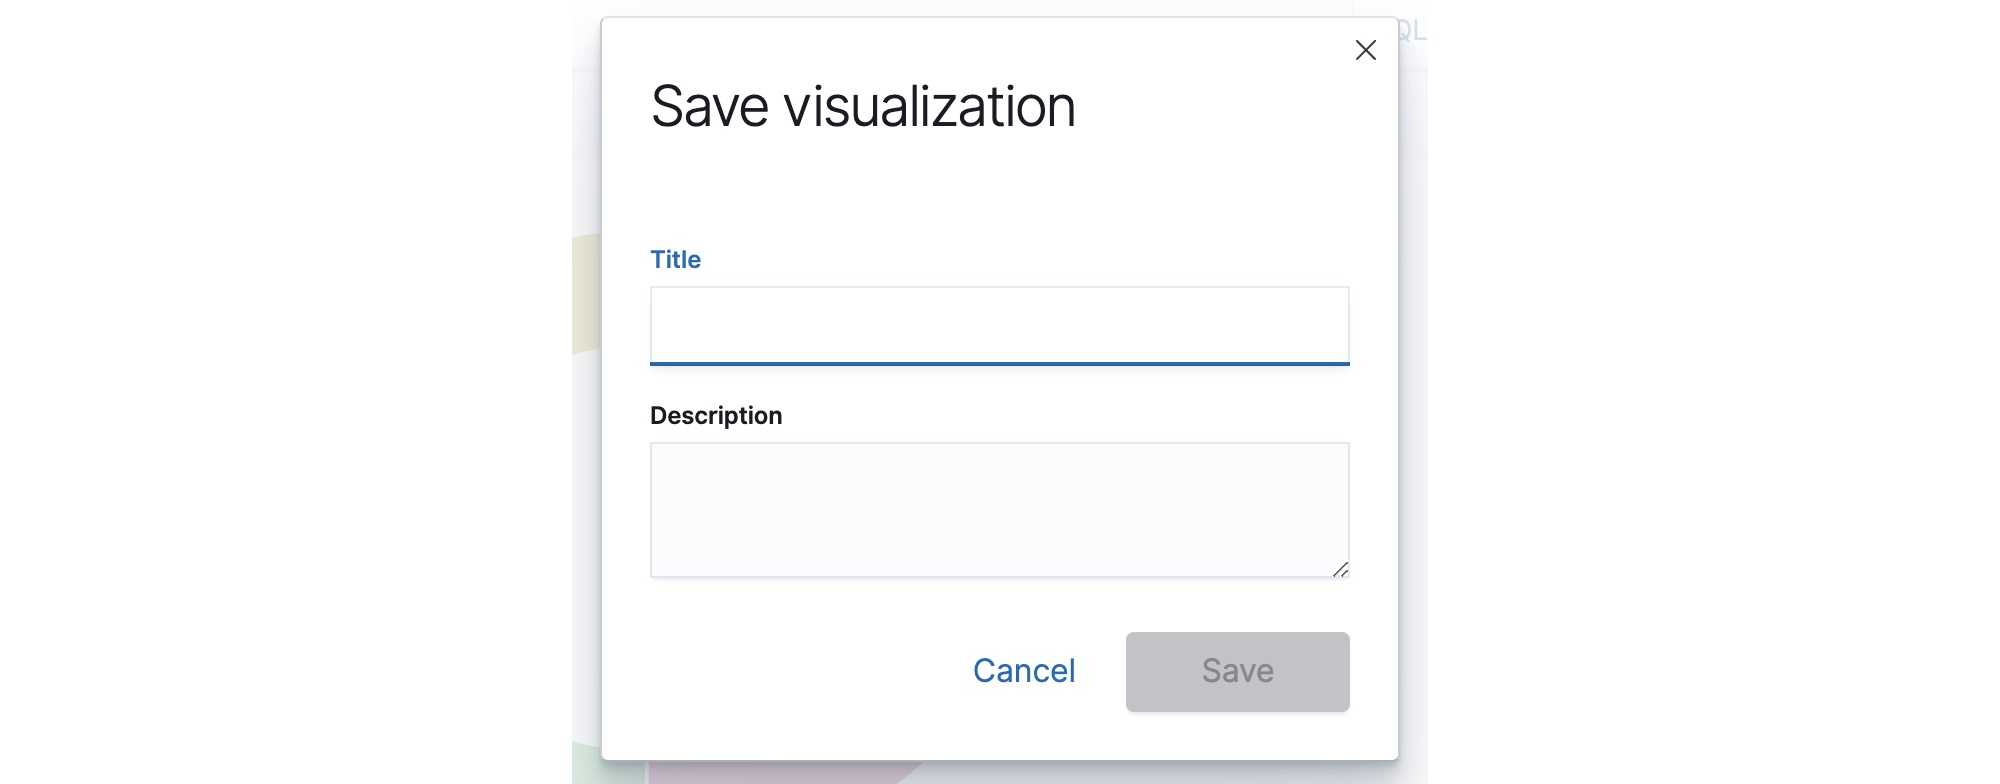
- Type a Title (which is visible on pages that list visualizations) and optionally a description, then click Save.
Your visualization is added to the list on the Visualize page as well as to the Saved objects page on the Configuration menu.
Deleting a Visualization
You can delete a visualization that is no longer needed.
To remove a visualization:
- On the Analytics > Visualize page, select one or more visualizations that you want to remove. The page updates to display a delete option.
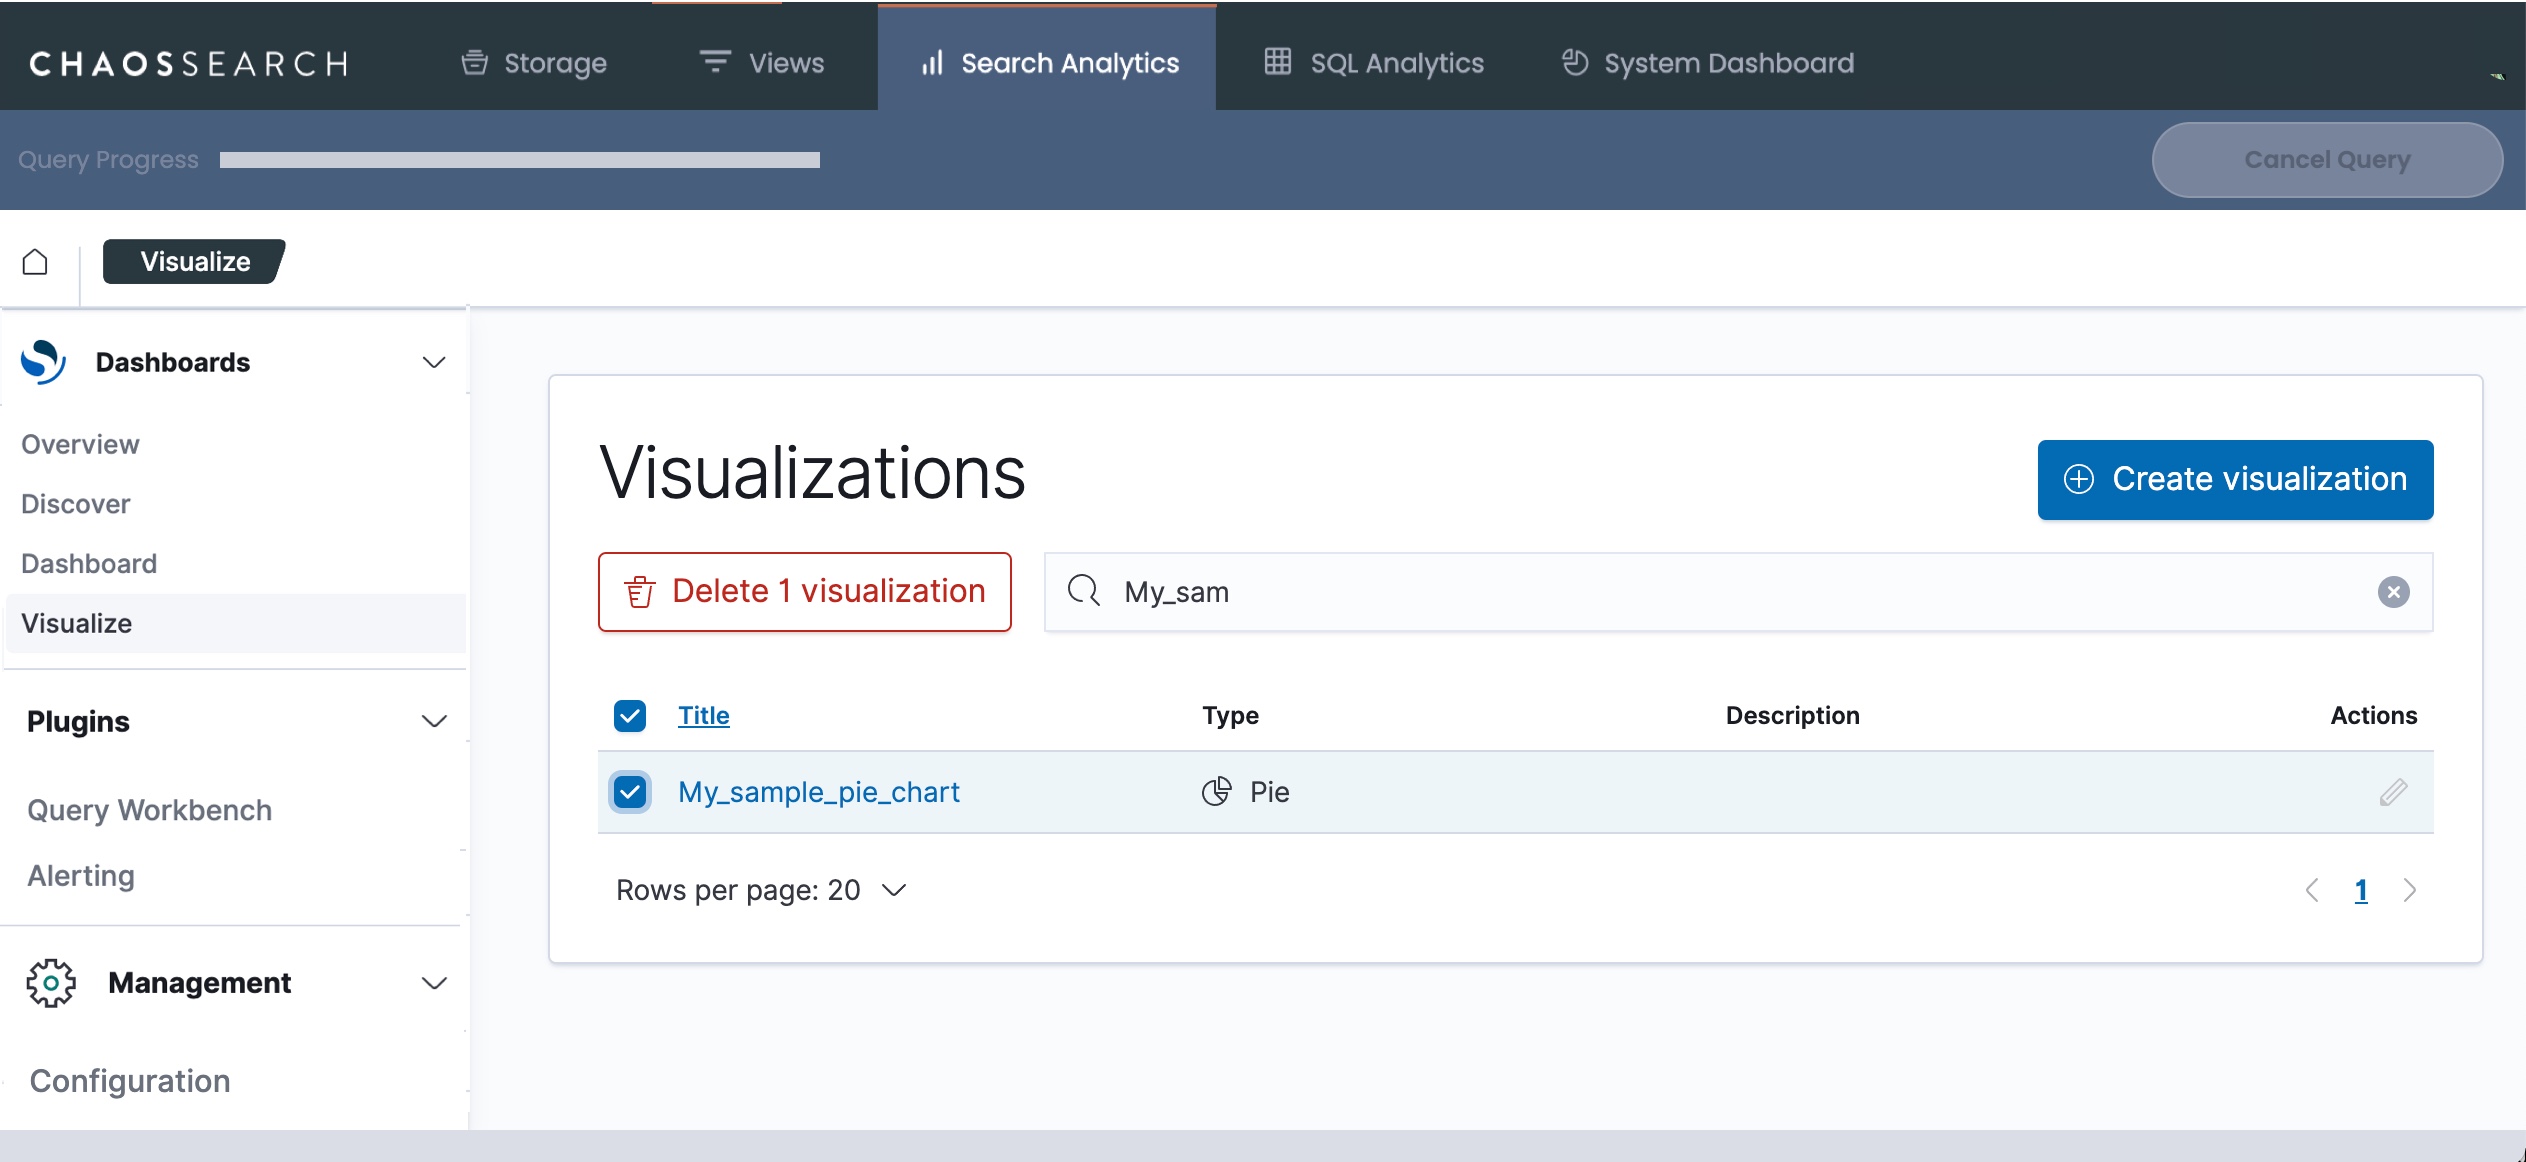
- Click the delete option (in this example, Delete 1 visualization). A confirmation window appears.

- Click Delete to remove the selected visualization(s) from the list.
Updated about 1 year ago
Did this page help you?