Getting Started with SQL Analytics
Run SQL queries, create charts, and review dashboards to gain valuable insights within your indexed data.
SQL Analytics is the console page that opens an embedded Apache Superset analytics interface with SQL querying and visualization features. You must have at least one view to use SQL Analytics.
In the ChaosSearch console, click SQL Analytics to navigate to the Superset interface.
To run a basic SQL query:
- Click SQL Lab > SQL Editor to open the SQL query page.
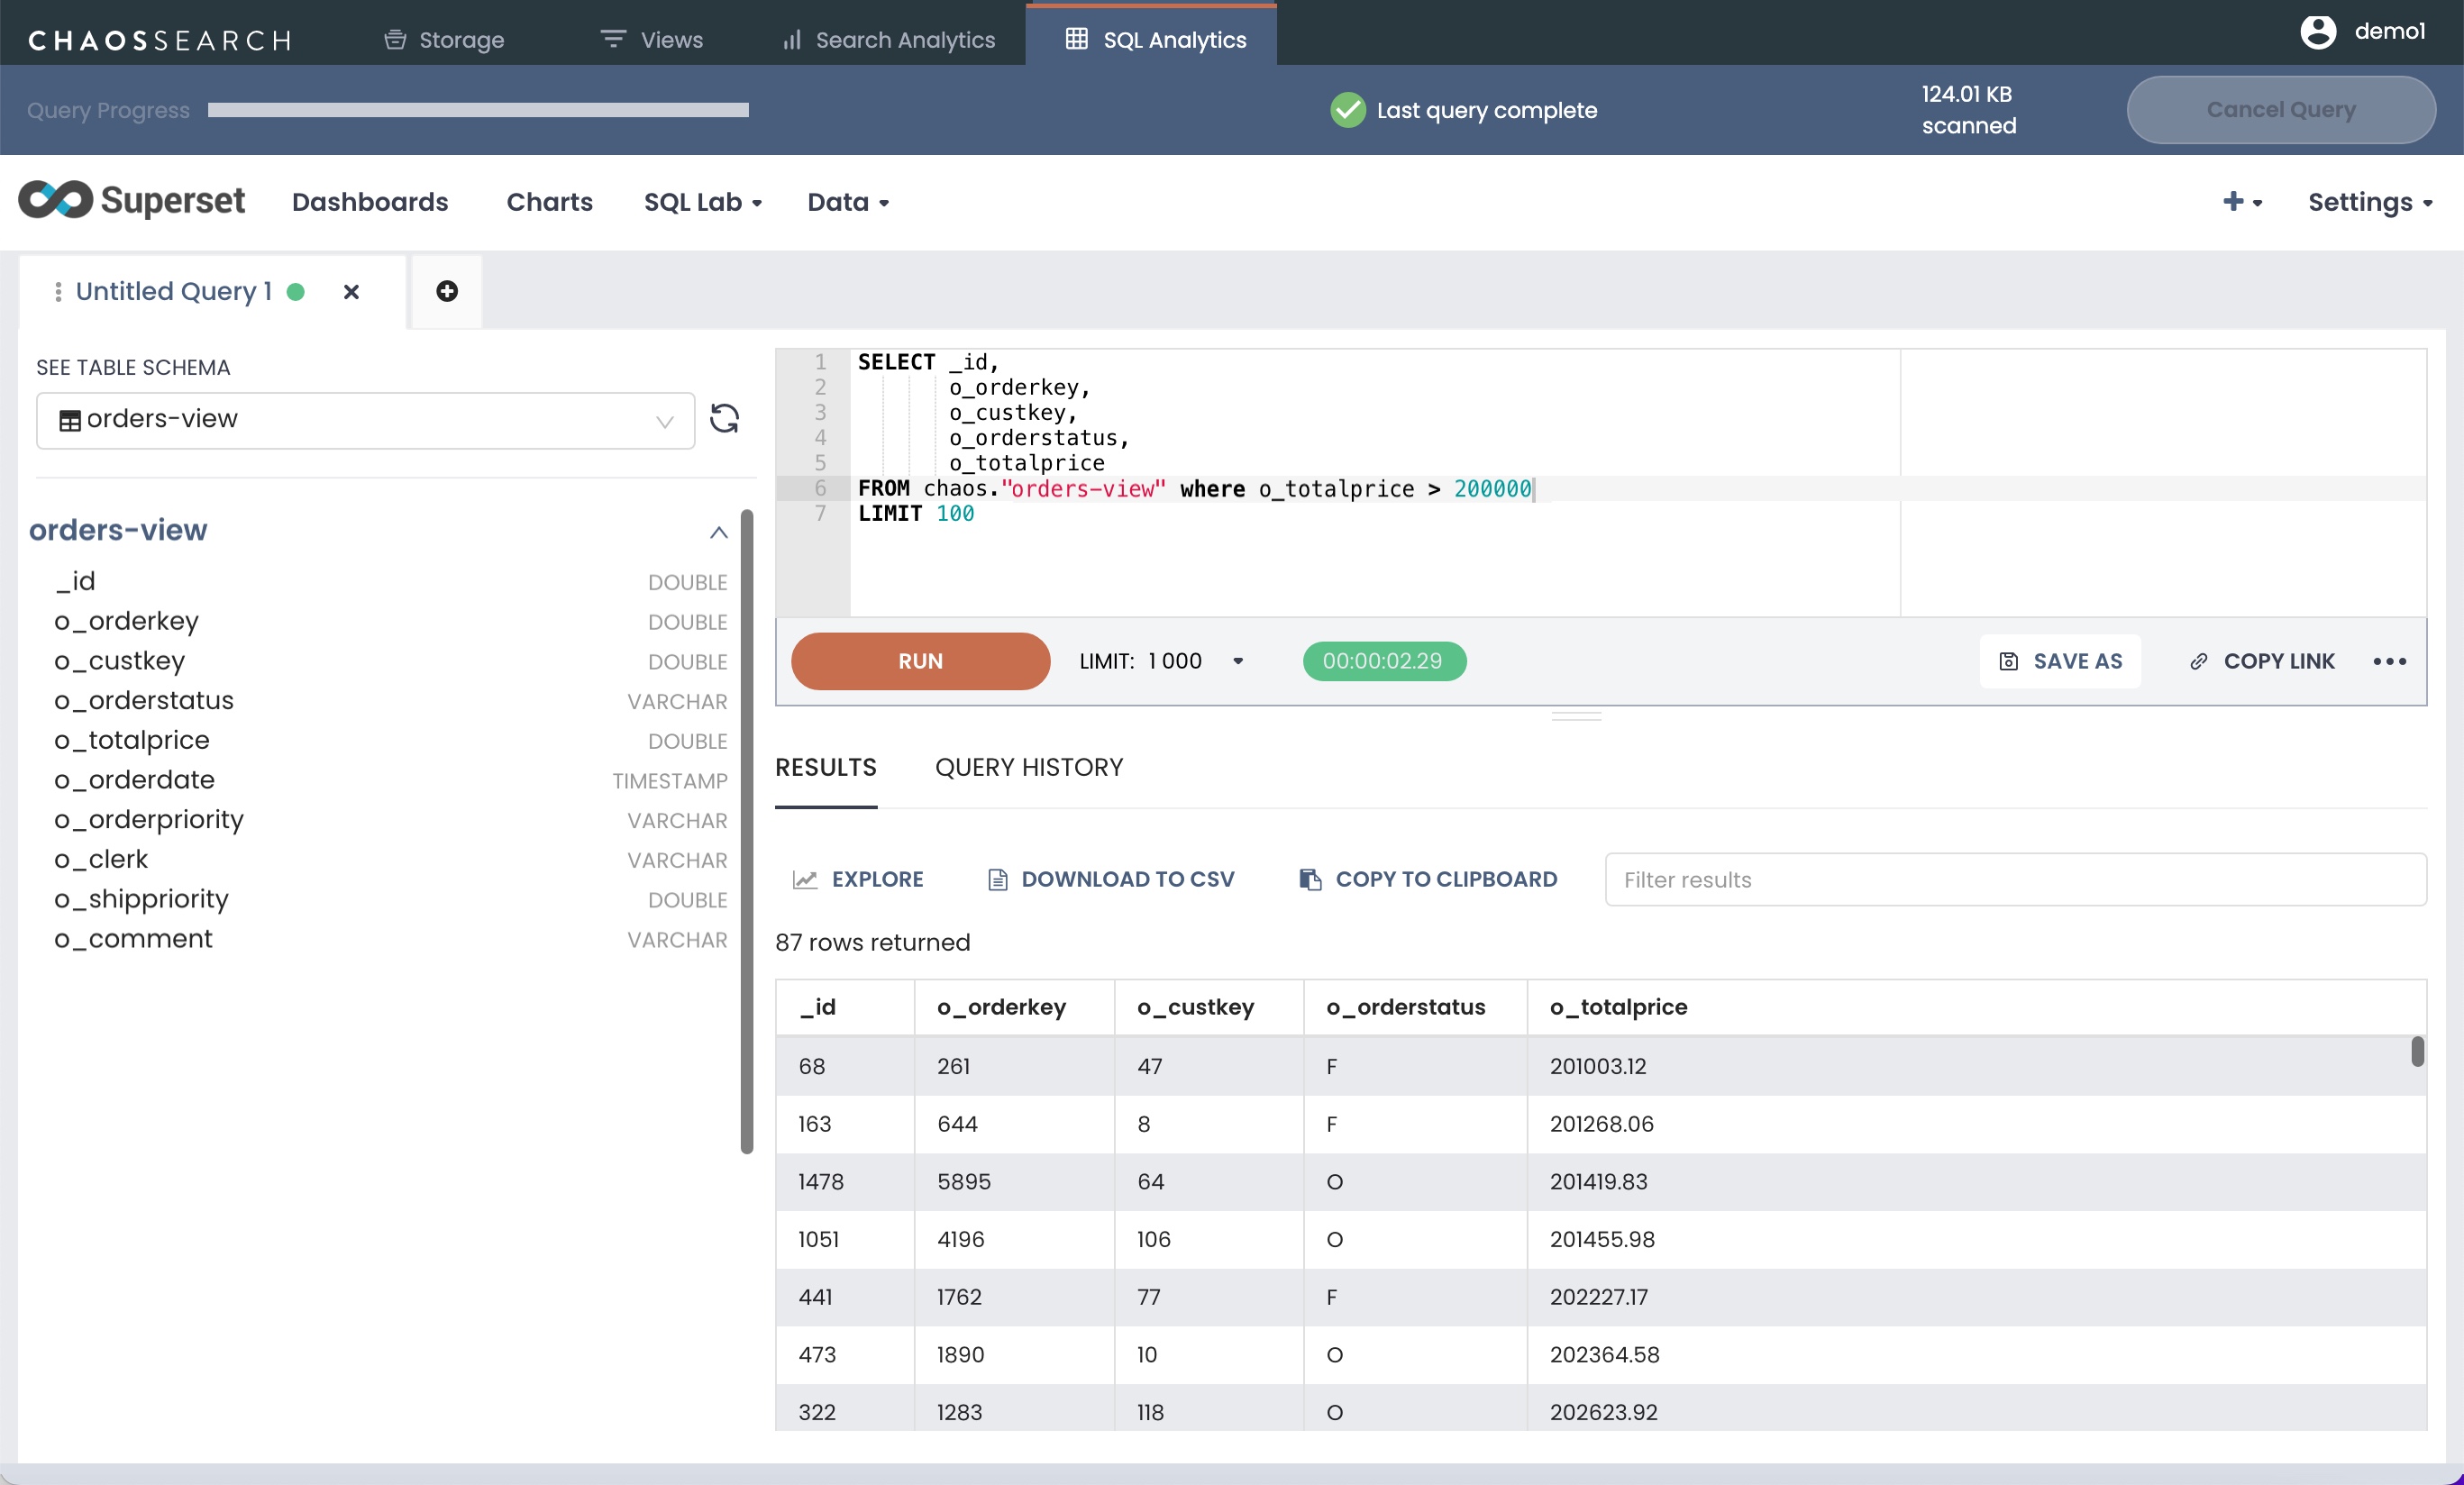
- Optionally, in the left menu, select a Refinery view in the See Table Schema field to display its columns.
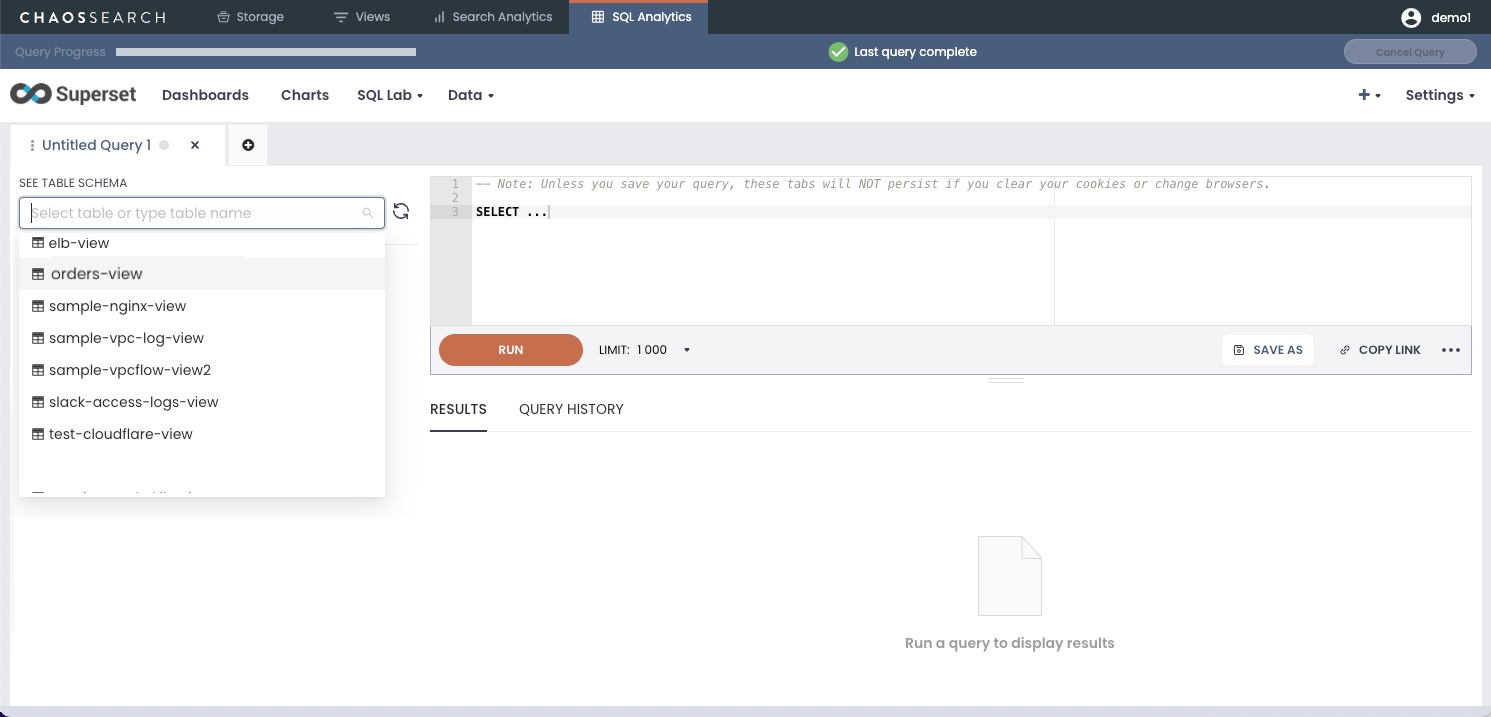
- In the top query constructor area, type or paste a SQL query to run. Click Run to see the results in the lower right Preview area.
Charts and Dashboards
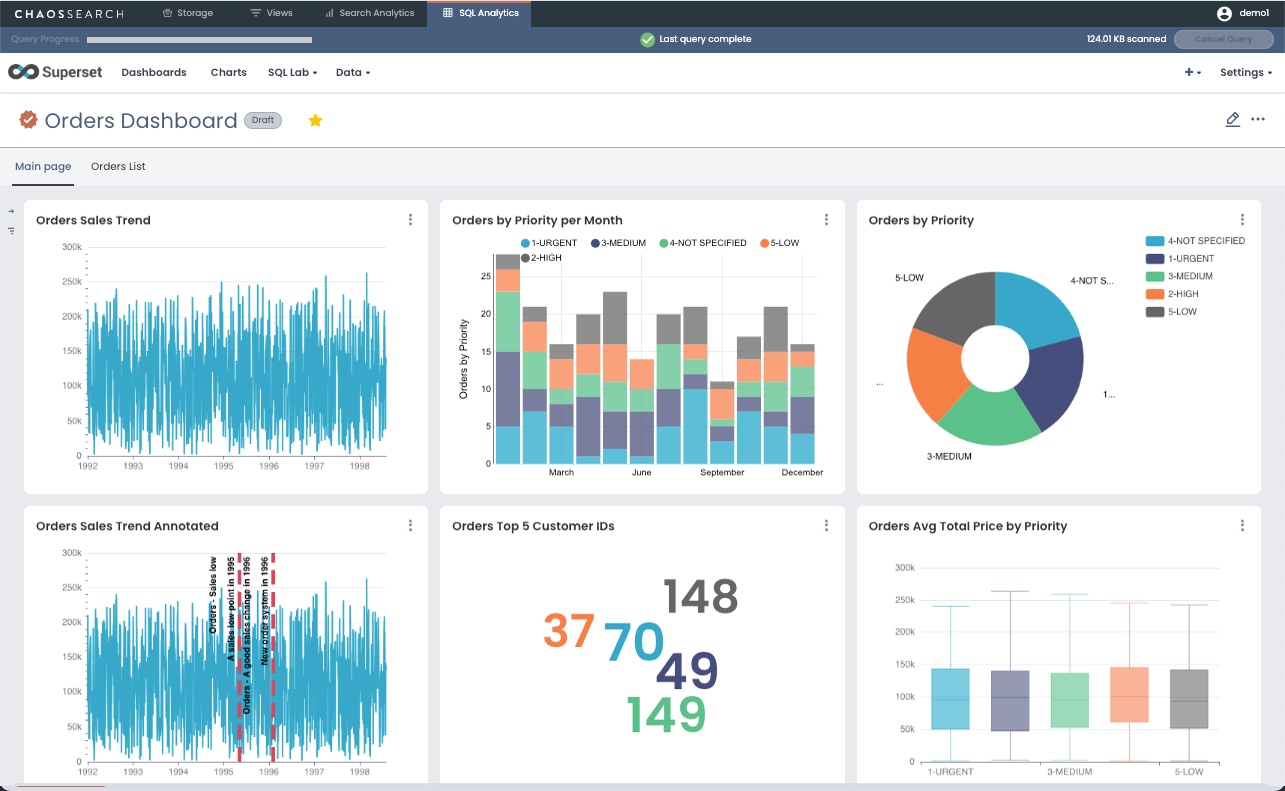
Some users might have pre-built charts and dashboards that offer graphical or tabular representations of data analysis for their log and event files, built by ChaosSearch Customer Success or by their customer data analysts.
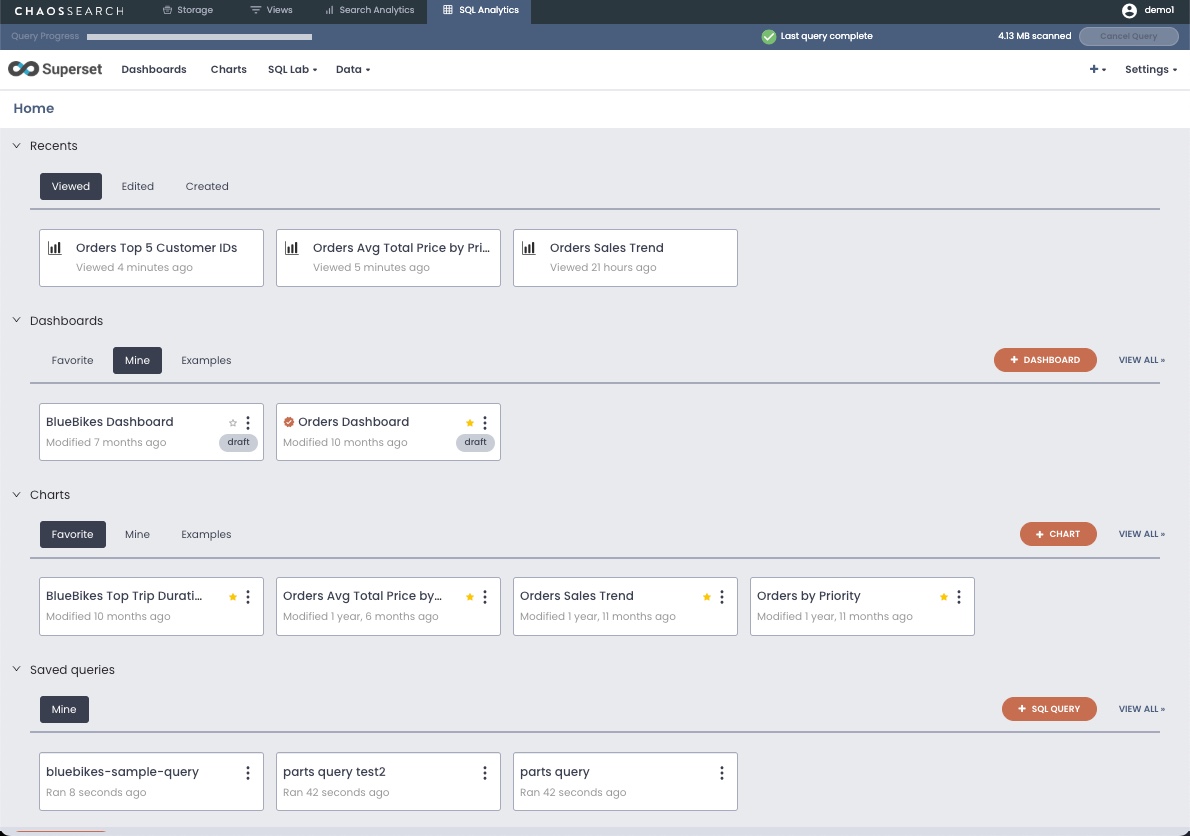
Click the Superset logo to return to the Home page to check for pre-built charts or dashboards that you can use. The following image is a sample dashboard of orders data:
Creating charts and dashboards can take some time and practice for new users to learn, especially for developing the analytics that support them. The Superset interface offers guidance to help with the process for creating them.
Updated about 1 year ago