Create a Dashboard
Use dashboards to create a summary of key graphics for users.
A dashboard is a multi-chart (multi-image) view of related data that can provide users and analysts with a related story of volume, trends, and behaviors. Dashboards can help to show corresponding relationships, supporting data, or correlations that can present a more complete summary for conditions in the environment.
You can create dashboards from a number of different spots in the UI, but a common starting point is the + menu > Dashboard in the navigation bar, or the +Dashboard button on pages like the Dashboards page.
To create a dashboard:
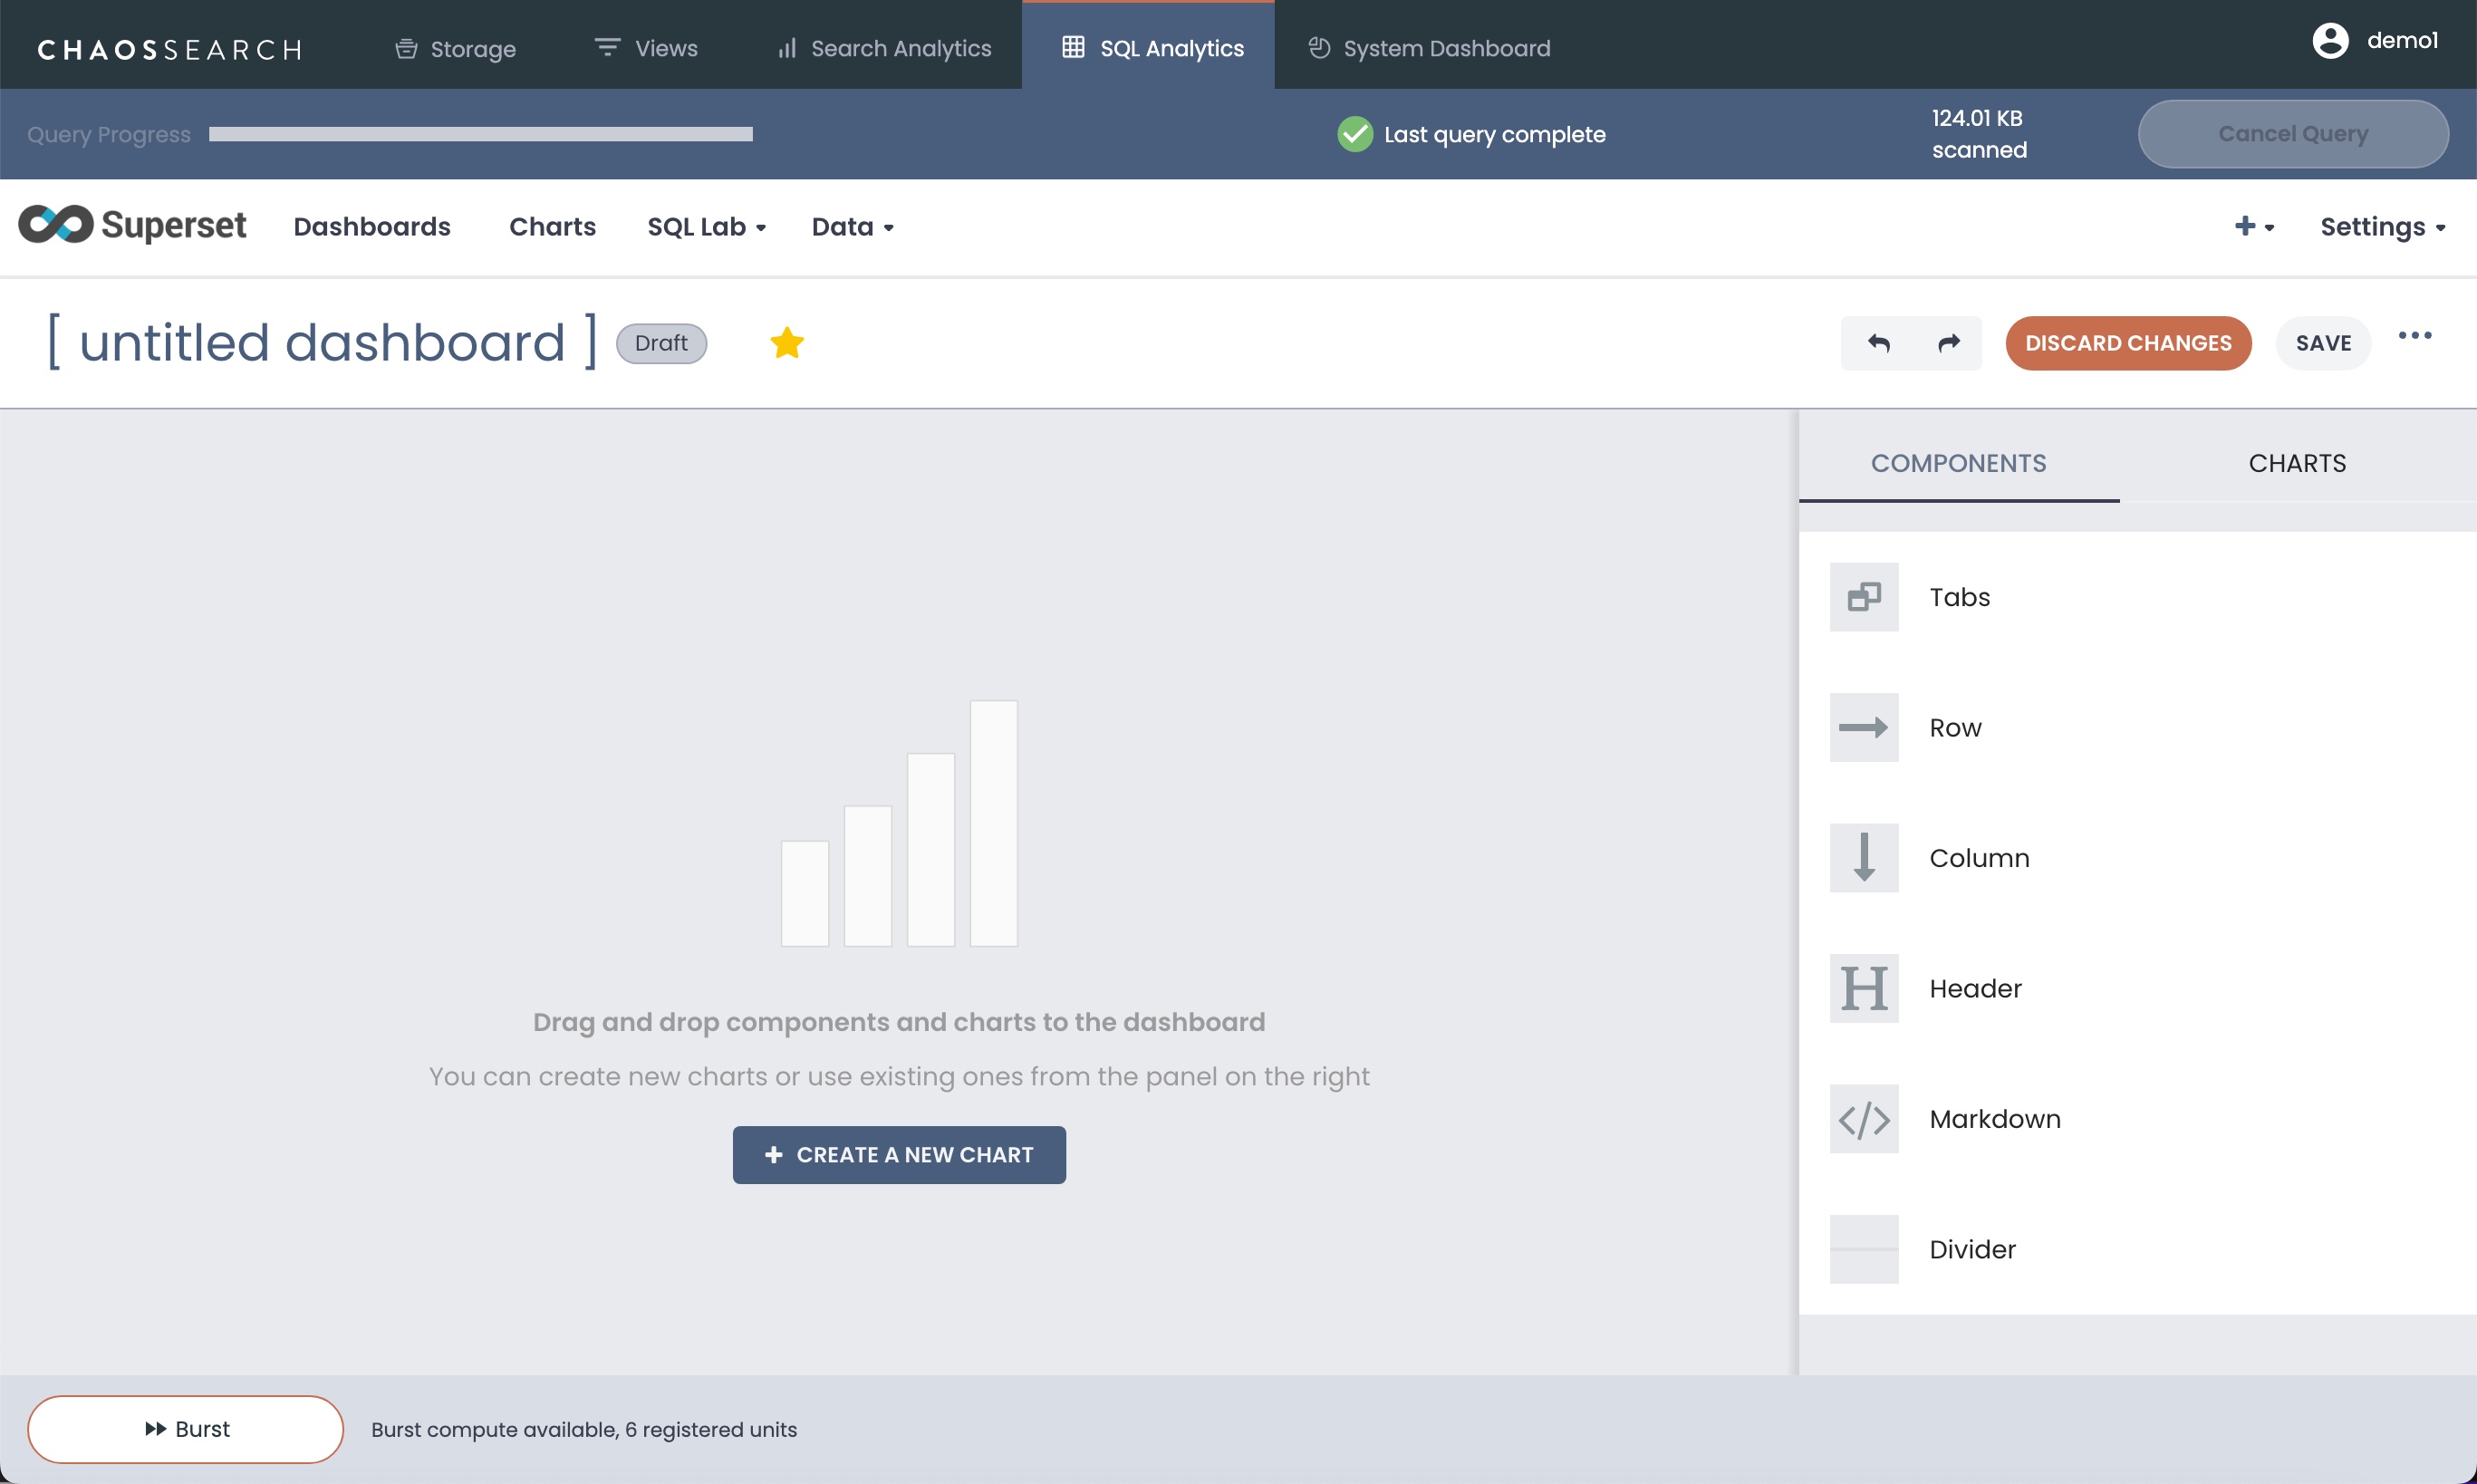
- Click + > Dashboard in the navigation bar. An [untitled dashboard] window opens.
-
In the Components list on the right, you can use the available tools to add tabs (to create multi-page dashboards), you can create rows, columns, headers, and panes as well as add Markdown text for comments to customize the layout and appearance of the dashboard page.
-
You can click Create a New Chart to open the Add a New Chart window and define a chart for the dashboard. See Create a Chart.
-
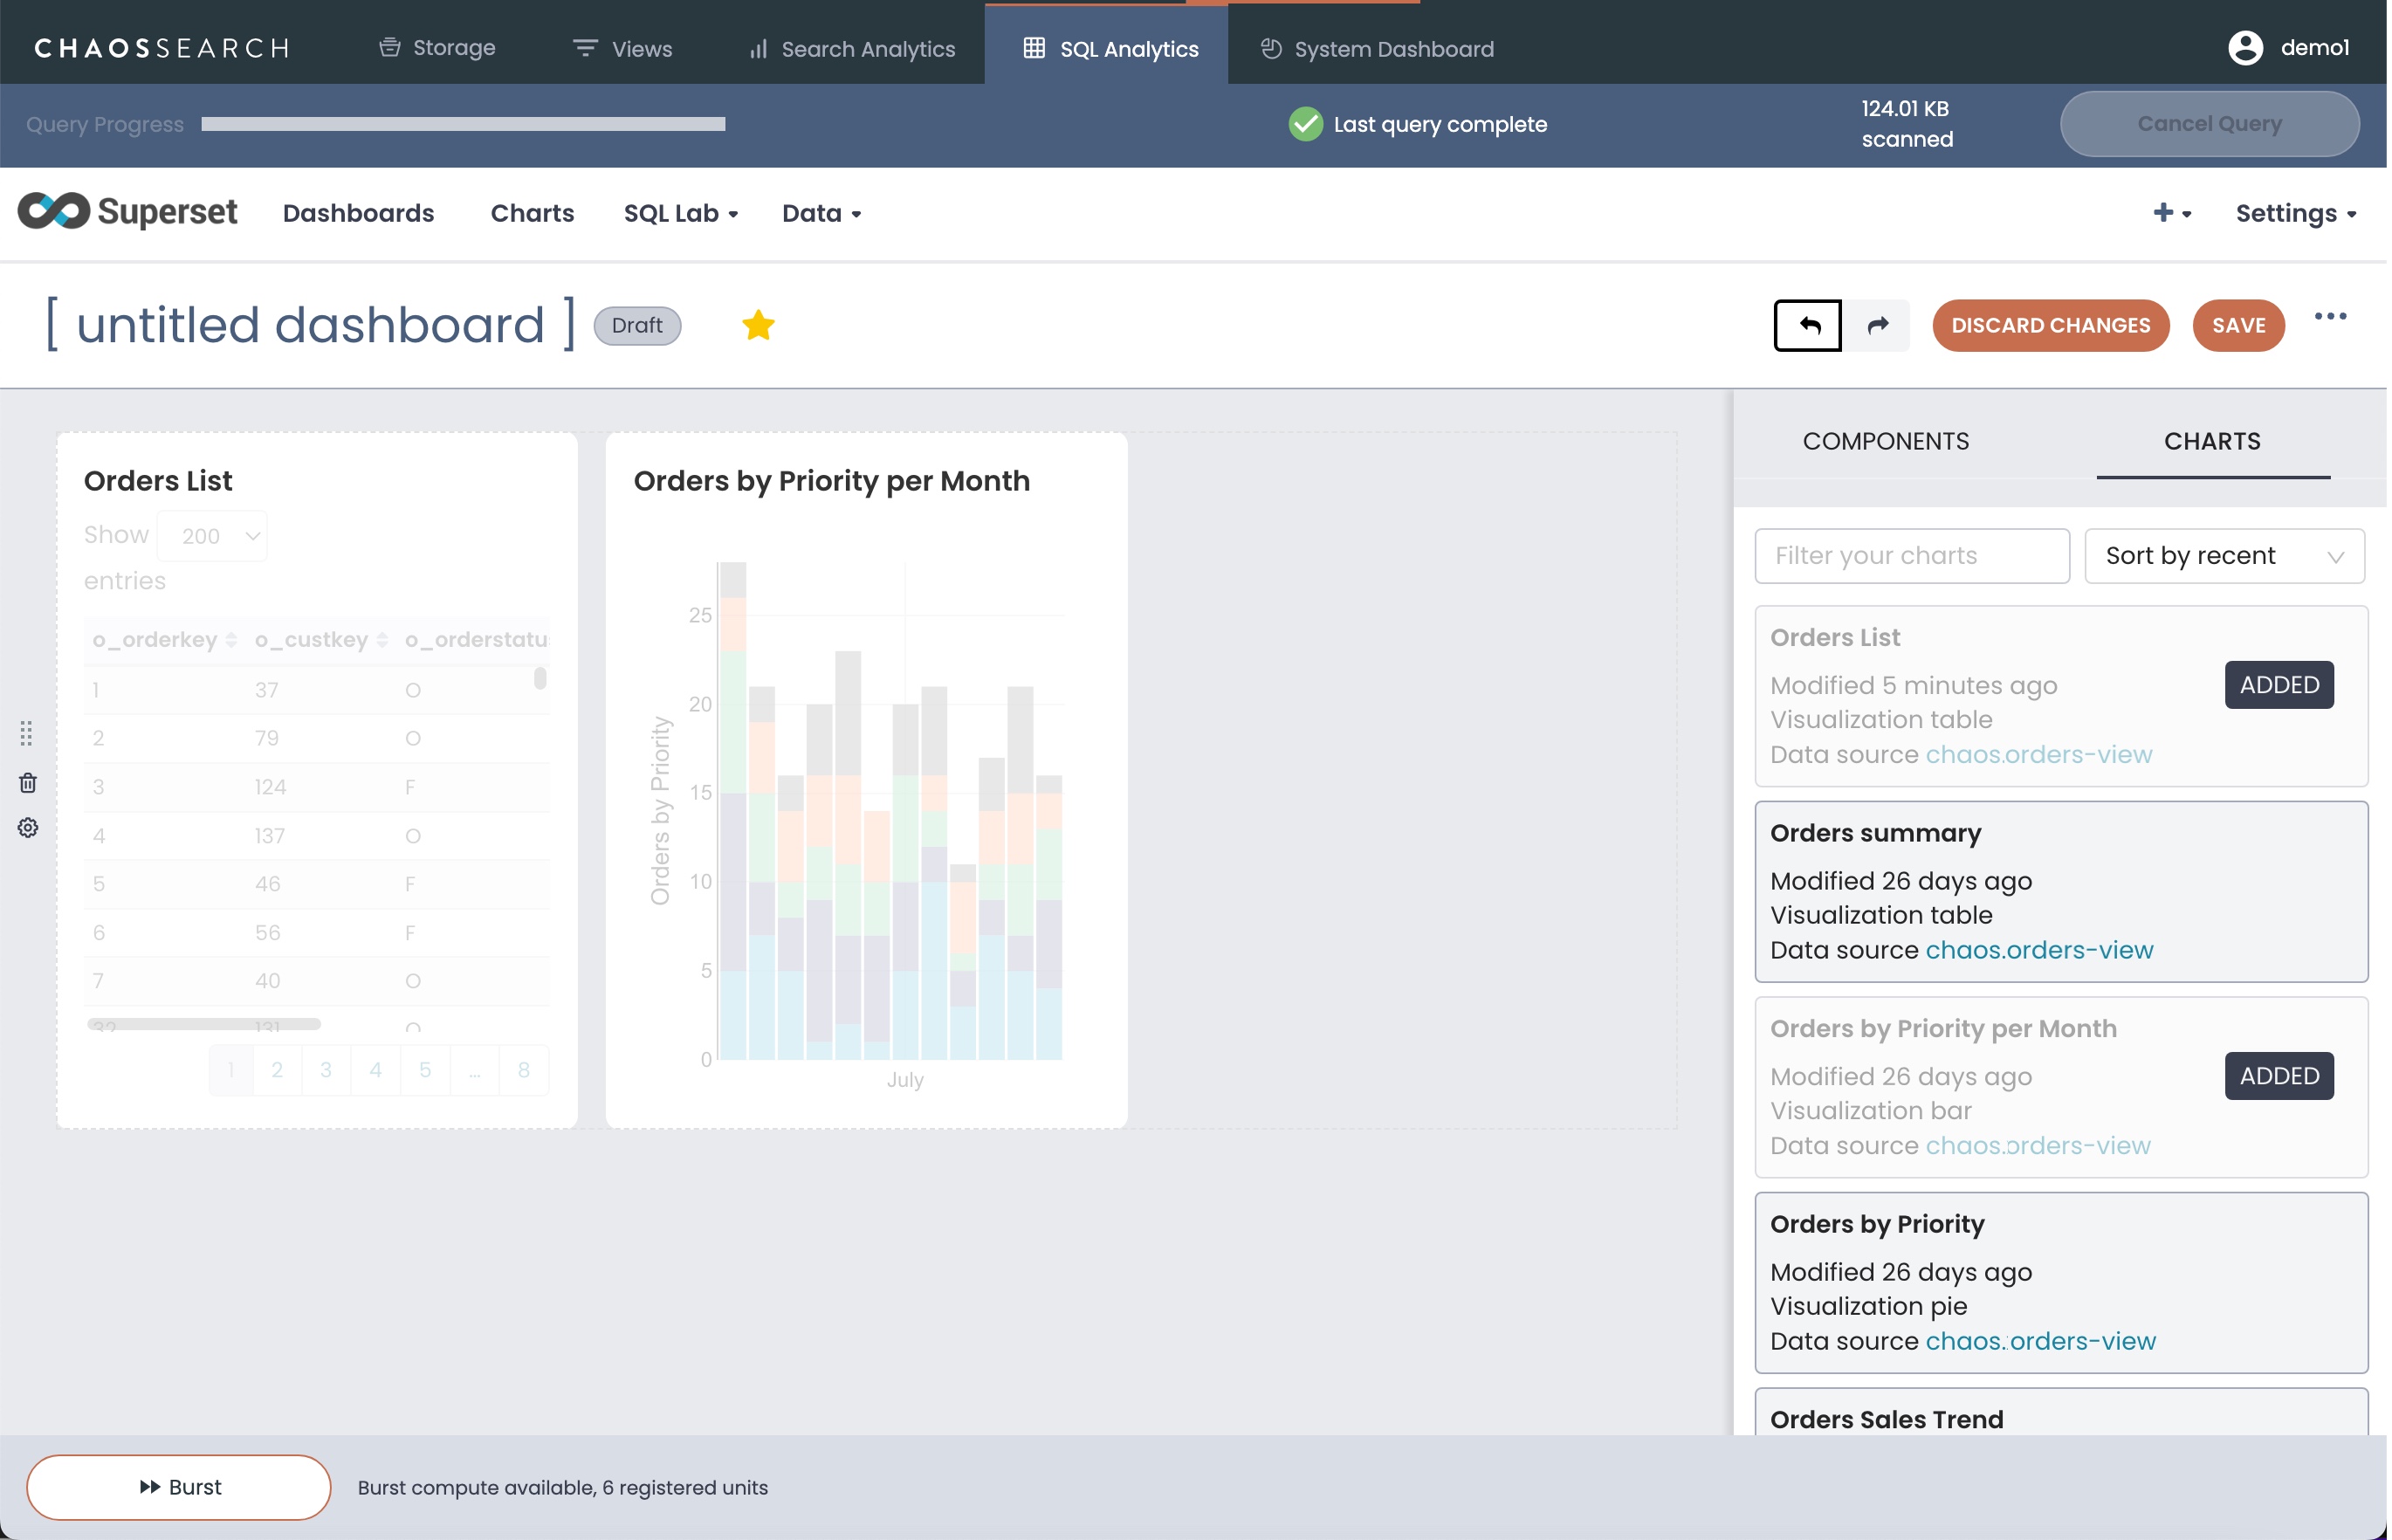
If you already have defined charts ready to add to your dashboard, click Charts in the right pane.
-
Drag defined charts from the right list into the main dashboard window to add them to the dashboard pane in the location where you want the charts to appear. Note that each chart definition can be added only once to the same dashboard; you cannot add the same chart on different tabbed pages, for example.
-
Type a title in the [untitled dashboard] text area.
-
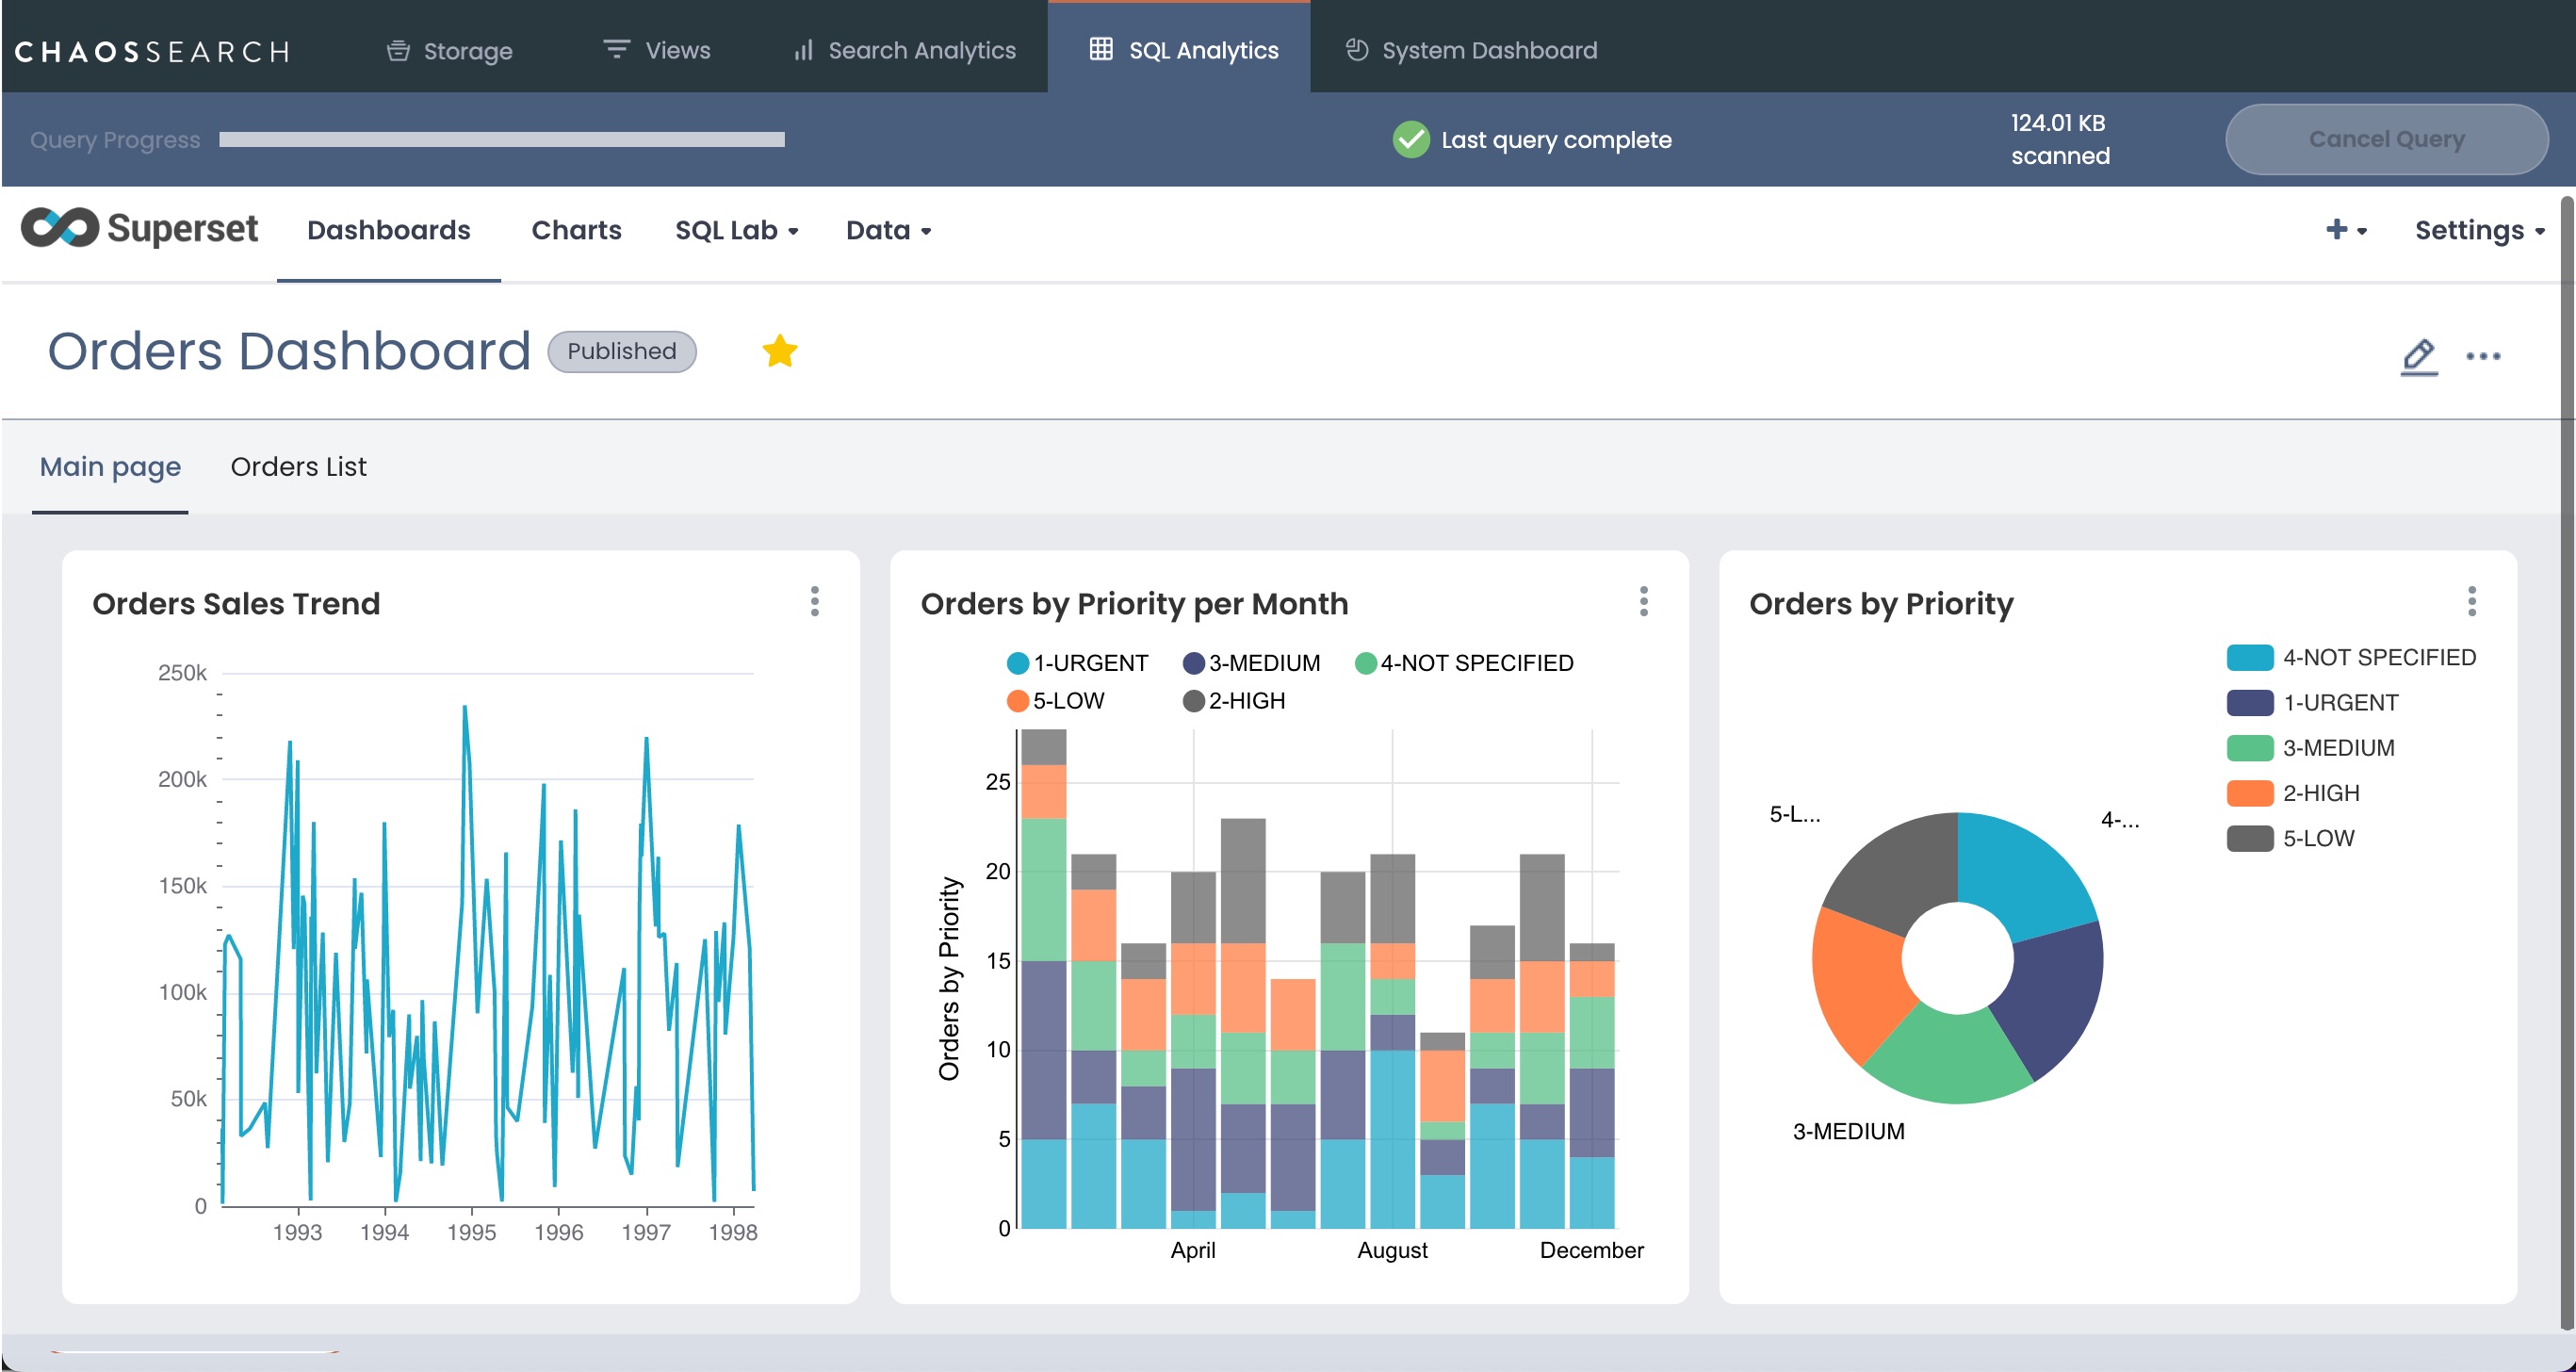
When you finish creating the dashboard, click Save. Note that the dashboard will be viewable by you, but not others until it is published.
-
Click Draft next to the dashboard title to change the dashboard to a published, visible dashboard.
You can now display the dashboard from the Dashboards page.
When you create a dashboard that you want to preserve, you can export the dashboard to save the information about the dashboard and charts to a file on your workstation for later imports if needed.
Updated about 1 year ago