Alert Monitors
Use monitors to specify conditions to watch for in your log and event data.
A monitor specifies an important condition to look for in log and event files indexed by ChaosSearch. You can define a condition using a query DSL definition (similar to the query produced by a Discover search), or by using a visual graph definition in the Create monitor UI.
A monitor requires at least one associated trigger to define the action to take when a condition is detected. When partnered with a trigger, the monitor can be enabled to watch for the defined trigger condition and to raise an alert displayed on the Alerts page. If the trigger is configured with a destination, the notifications for an alert will also be sent to the destination.
Creating a Monitor
To create a monitor:
- In Search Analytics > Alerting, click the Monitors tab.
The Monitors page opens with a list of the currently defined monitors. The page includes a summary of information such as whether monitors are enabled or disabled, their last update, and information about related alerts and errors. From this page you can perform actions such as acknowledging alerts and managing monitors.
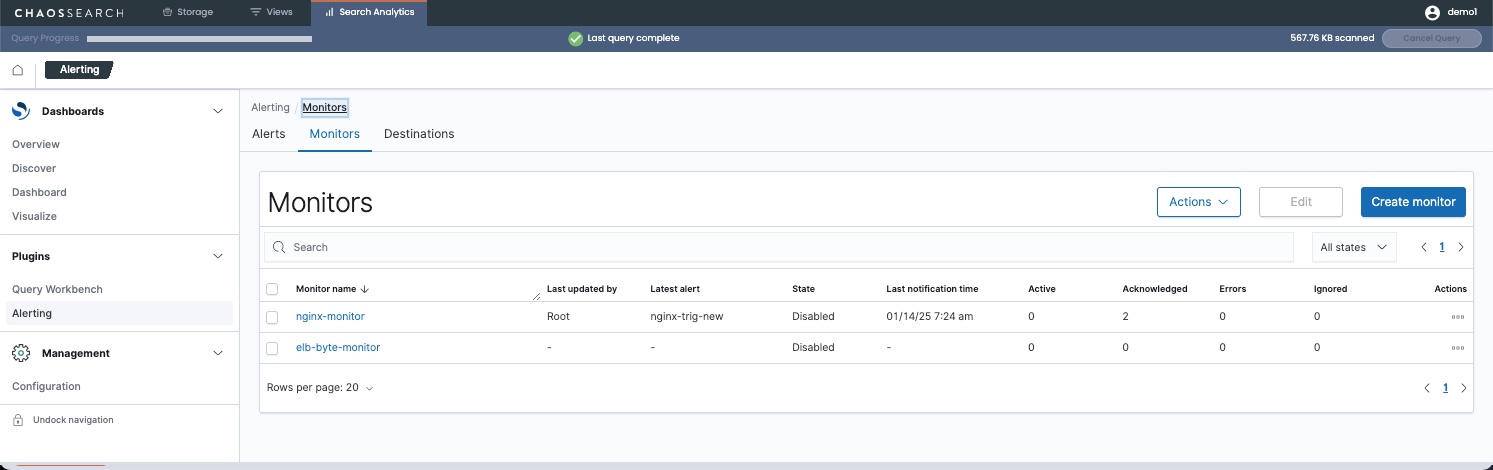
- Click Create monitor. The Create monitor window opens.
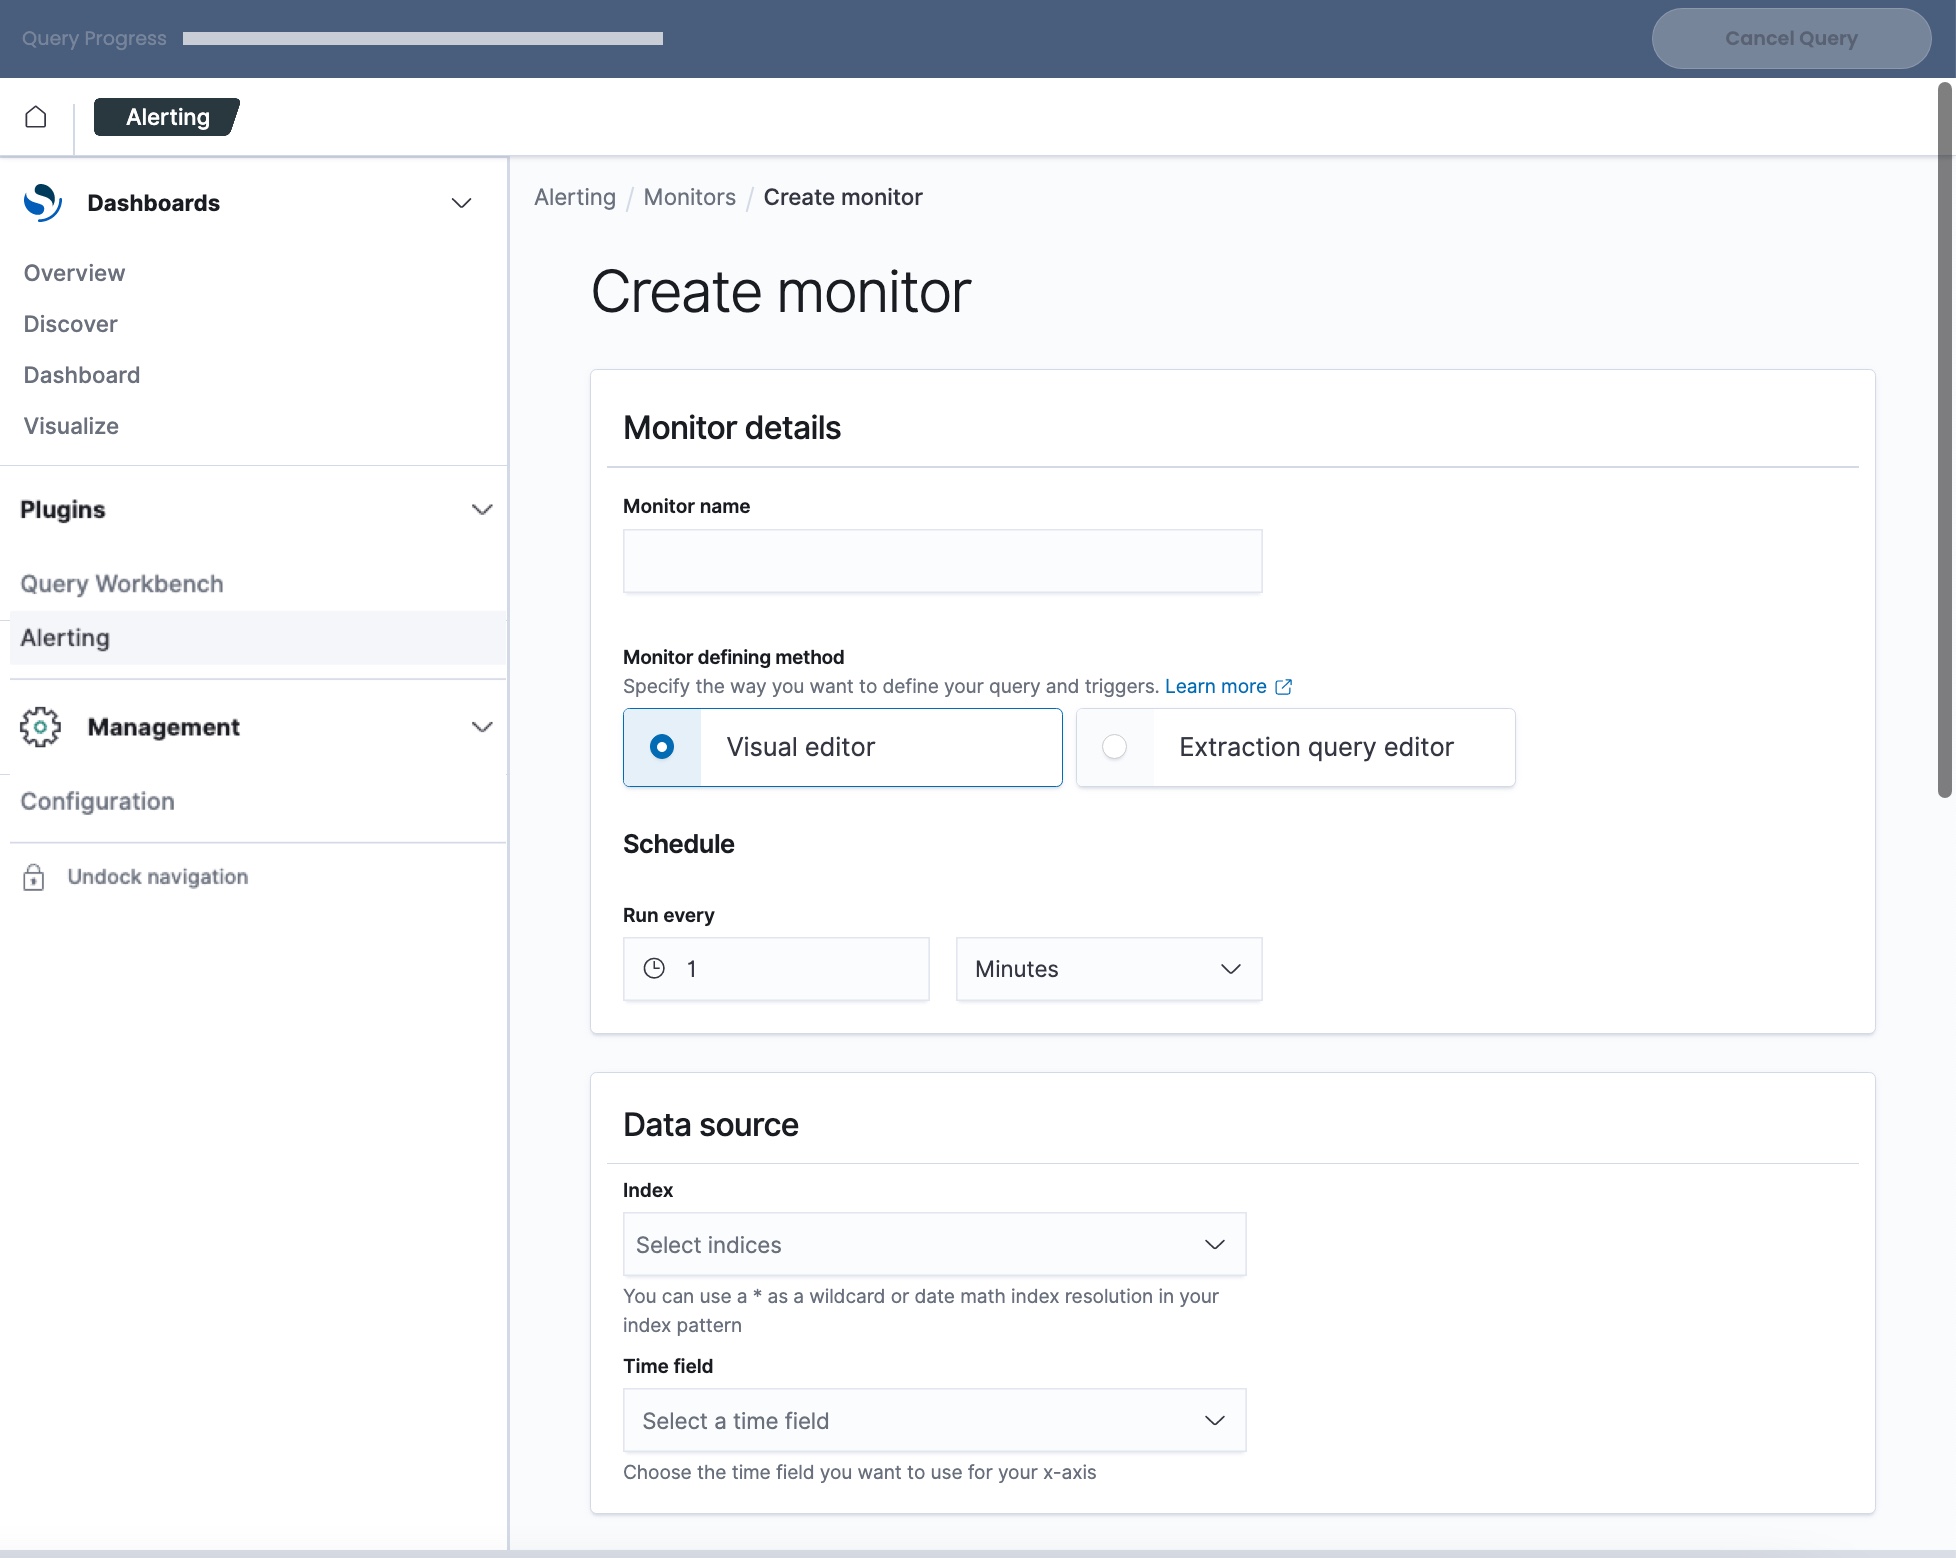
- In the Monitor name field, type a name for the monitor.
- In the Monitor defining method field, select how to define the monitor:
- Select Visual editor to use a visual graph to specify a view and a condition to watch for.
- Select Extraction query editor to specify a view and an Elasticsearch query DSL that defines the condition to watch for.
- In the Schedule field, configure how frequently you want to run the monitor to run to check for the condition. You can select a number and a time unit (minutes, hours, or days).
- In the Data source section, in the Index field, select one or more views to use with the monitor.
- The information to specify for a visual query and an extraction query method is different; see the following sections Using an Extraction Query or Using a Visual Editor for details about each type of method.
- Specify one or more triggers to define conditions or thresholds that you want to watch for, and to specify the alert message and optionally a destination. A monitor must have at least one trigger to enable the monitor. See Define Triggers for a Monitor.
- Click Create to save the new monitor.
Review the following sections for more details about the monitor definition options.
Using an Extraction Query
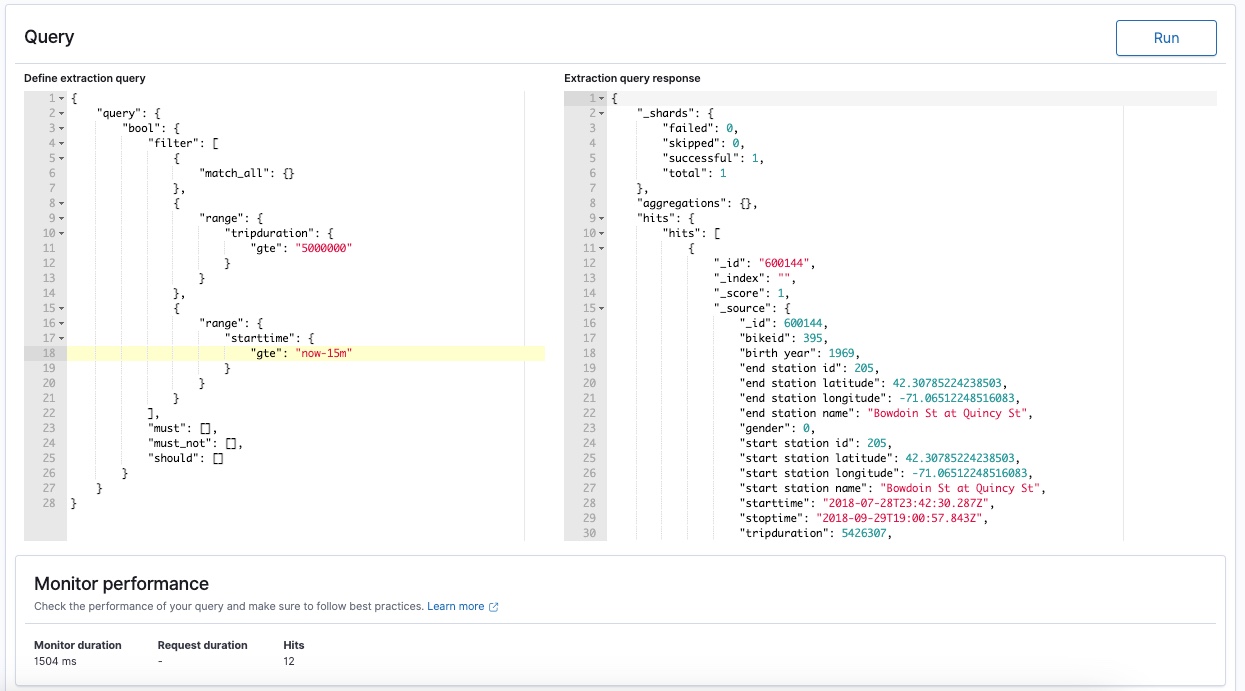
If you select the Extraction query editor method to define a monitor, as in the following example, the window updates to show the fields that you must define for the monitor.

- In the Data Source > Index field, select the Refinery view to use with the monitor.
The window displays a Query section with two fields. The left column Define extraction query defaults to a full match_all query DSL operation. The right column Extraction query response is initially empty.

- Click Run to populate the column on the right. The response in the right column shows the values retrieved from the selected view. These are fields that could be added to the extraction query that you build in the left column.
Use Caution with DSLsizeParameterThe
sizeparameter is a useful field that can help to limit the size of a monitor result set. You could use this to return a specific number of results, or no results (which could provide monitor performance benefits if the result fields are not needed). If you specify"size": 0in the extraction query to hide the results fields, note that you will not be able to use many of the Monitor Variables in action messages.

- Specify your query DSL extraction query in the left column to define the monitoring condition. For more information about supported query syntax, see Elasticsearch API Support.
As an example, the following query DSL searches for a domain value in the indexed data for the view from the last 15 minutes:
{
    "query": {
        "bool": {
            "filter": [
                {
                    "match_phrase": {
                        "domain": {
                            "query": "test.domain.com"
                        }
                    }
                },
                {
                    "range": {
                        "@timestamp": {
                            "gte": "now-15m"                        }
                    }
                }
            ]
        }
    }
}
Another simple query DSL example for a tripduration field that reaches or exceeds a defined threshold:
Using a Visual Editor
If you select the Visual editor method for a monitor definition, as in the following example, the monitor window updates to show new fields for the visualization.
- In the Data Source > Index field, select the Refinery view to use with the monitor. The window displays new fields for the visualization details.
- In the Time field, select the time column that you want to use for the X axis date histogram. Click the field to select one of the timeval fields in the view.
- In the Query pane, the default metric is a count of documents (in ChaosSearch, that means a hits/records count). Click Add metric to add a specific metric from the view to visualize instead of the hits count.
- In the Time range for the last field, specify the monitoring time range. For example, to check the last 1 hour of the log and event files related to the view that you selected, select 1 from the number drop-down, and hour(s) from the units drop-down list. The available units are minutes, hours, or days.
- In the Data filter field, you can specify one optional filter rule to apply to the monitoring query.
- In the Group by field, you can specify one optional group by rule to group the results of the monitor query.
- Click Preview query and performance. The window updates to display a graph area, and populates the data for the graph within the time range you specified. The chart information also shows the monitor duration, runtime, and hits for the monitor query.

If a visual graph does not appear, there might not be data for your selected time period. Try adjusting the time range to a value where data is expected (such as last 30 minutes, or last hour) just as an example. Note that when testing alerts against static data, the time range could be many days in the past. As a best practice, configure alerts using live index views that will have new indexed data to evaluate.
Visual graphs monitors do not support all the variables in trigger messages.If you plan to use monitor variables in the trigger message definitions, note that the visual editor method for defining a monitor excludes results/hits detail using the
"size": 0field. This can hinder the use of many of the monitor variables to enrich the content of the trigger messages.As a hint, you can create a monitor using the Visual editor option, and then use the UI to convert it into an extraction query for you. Just define the monitor using Visual editor, save it, and then edit again and select Extraction query editor to see the saved, equivalent extraction query in DSL. Be sure to Preview and test the query (and adjust the
"size": 0field if needed) for your trigger messages.
Monitor Permissions and UsersWhen you create and save a monitor, the monitor definition is updated with the information for the ChaosSearch groups associated with your user account. Use caution when reviewing monitor definitions, because saving a monitor as a different user could break the monitor. If RBAC group assignments change, or if permissions assigned to the RBAC groups used for a monitor change, the monitor might not work after those updates.
See Troubleshooting Monitor Authorization Permissions for more information.
The next step for monitor creation is to Define Triggers for a Monitor.
Updated about 1 year ago
What’s Next
Read more about creating and tuning monitors and triggers