Getting Started with Search Analytics
Run Discover searches, create visualizations and dashboards, and monitor for conditions in your indexed data.
Search Analytics is the console page that opens an embedded OpenSearch Dashboards analytics interface with powerful log analytics hunting and visualization features. You must have at least one view to use Search Analytics.
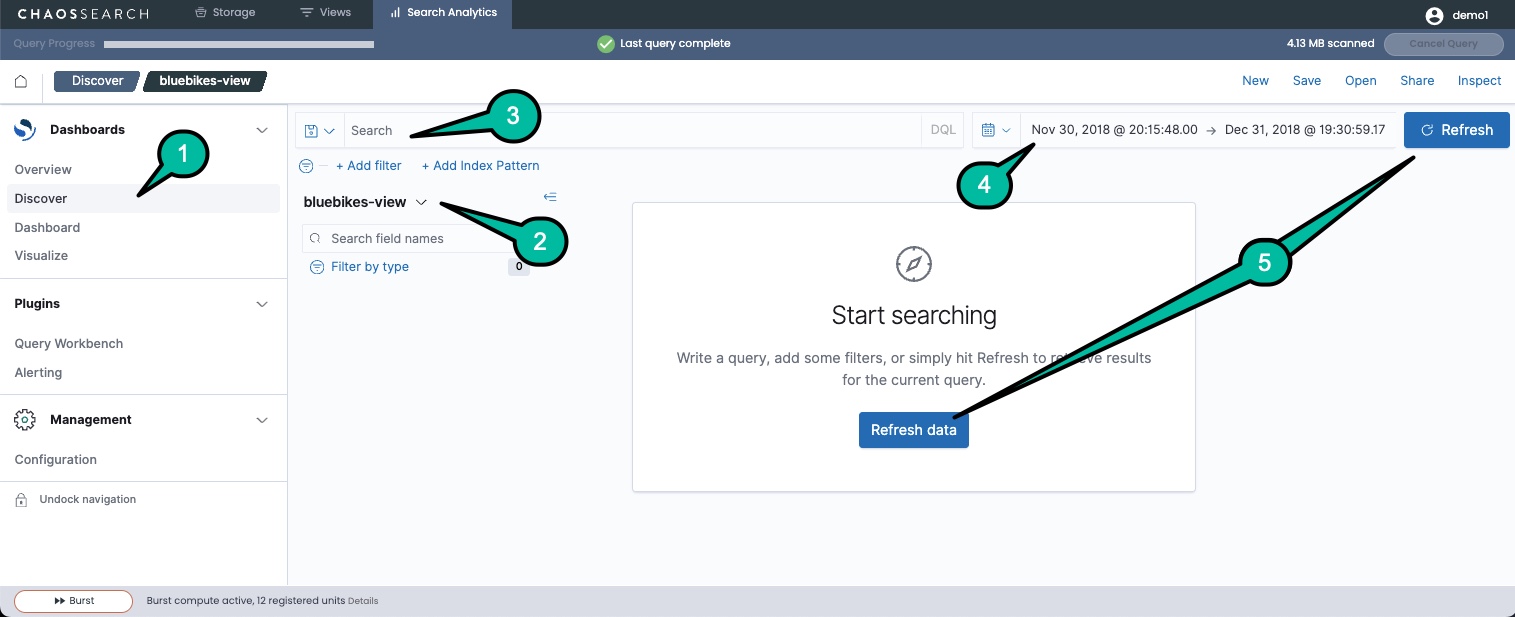
There are five steps to run a basic Discover search:
-
Make sure that you are on the Discover page.
-
Select a view in the drop-down list to specify the indexed data that you want to search.
-
Specify one or more search terms in the Search field. (If you leave Search blank, as in the screen above, the search returns all of the records for the time frame.)
-
Specify a time frame. The default is the last 15 minutes of data. For live indexes, the last 15 minutes is usually a good time range, or perhaps the last hour. (Be sure to use a time range that is aligned with the record timestamps inside the indexed data, or you might see the message
No results match your search criteria.) -
Click Refresh (or Refresh data) to run the search. A sample screen that uses several filters to narrow the results follows.
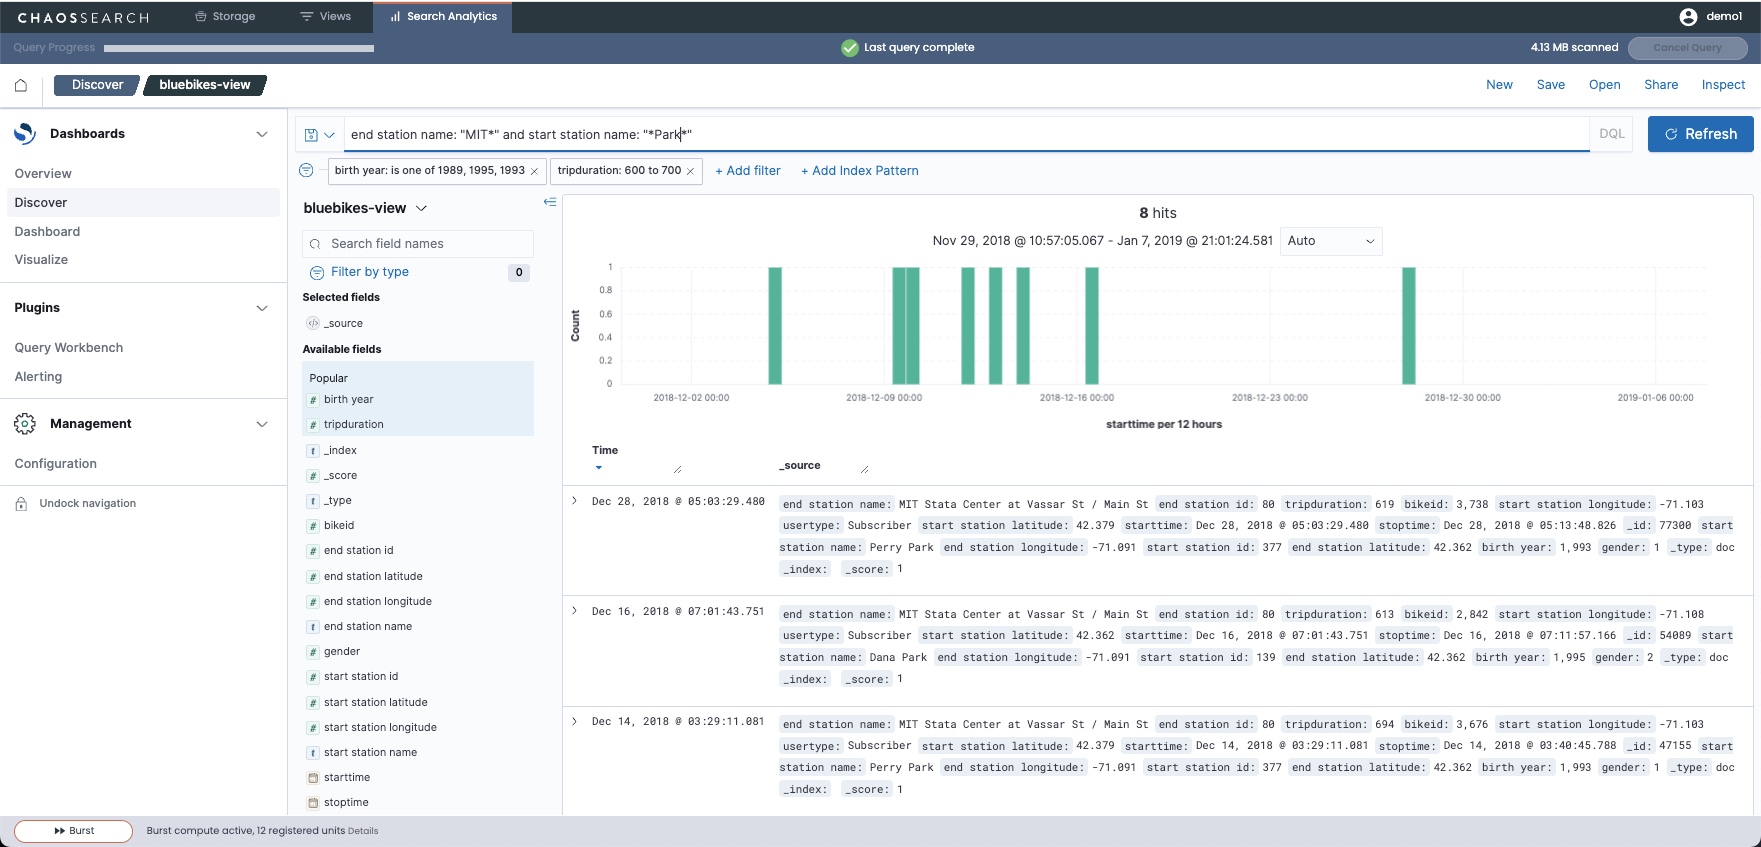
You can combine the field-level search criteria with AND, OR, and NOT syntax to create even more granular searches.
NOTES:OpenSearch Dashboards supports many search options such as wildcards, field-level searches, filter searches and combinations. More information is available in the Search Analytics help topics.
The Discover page uses Dashboards Query Language (DQL) syntax.
Visualizations and Dashboards
Visualizations offer another representation that turn your search queries into graphical or tabular displays that can be quickly reviewed to show important information in your indexed data. You might have some dashboards and visualizations built by ChaosSearch Customer Success or your data analysts.
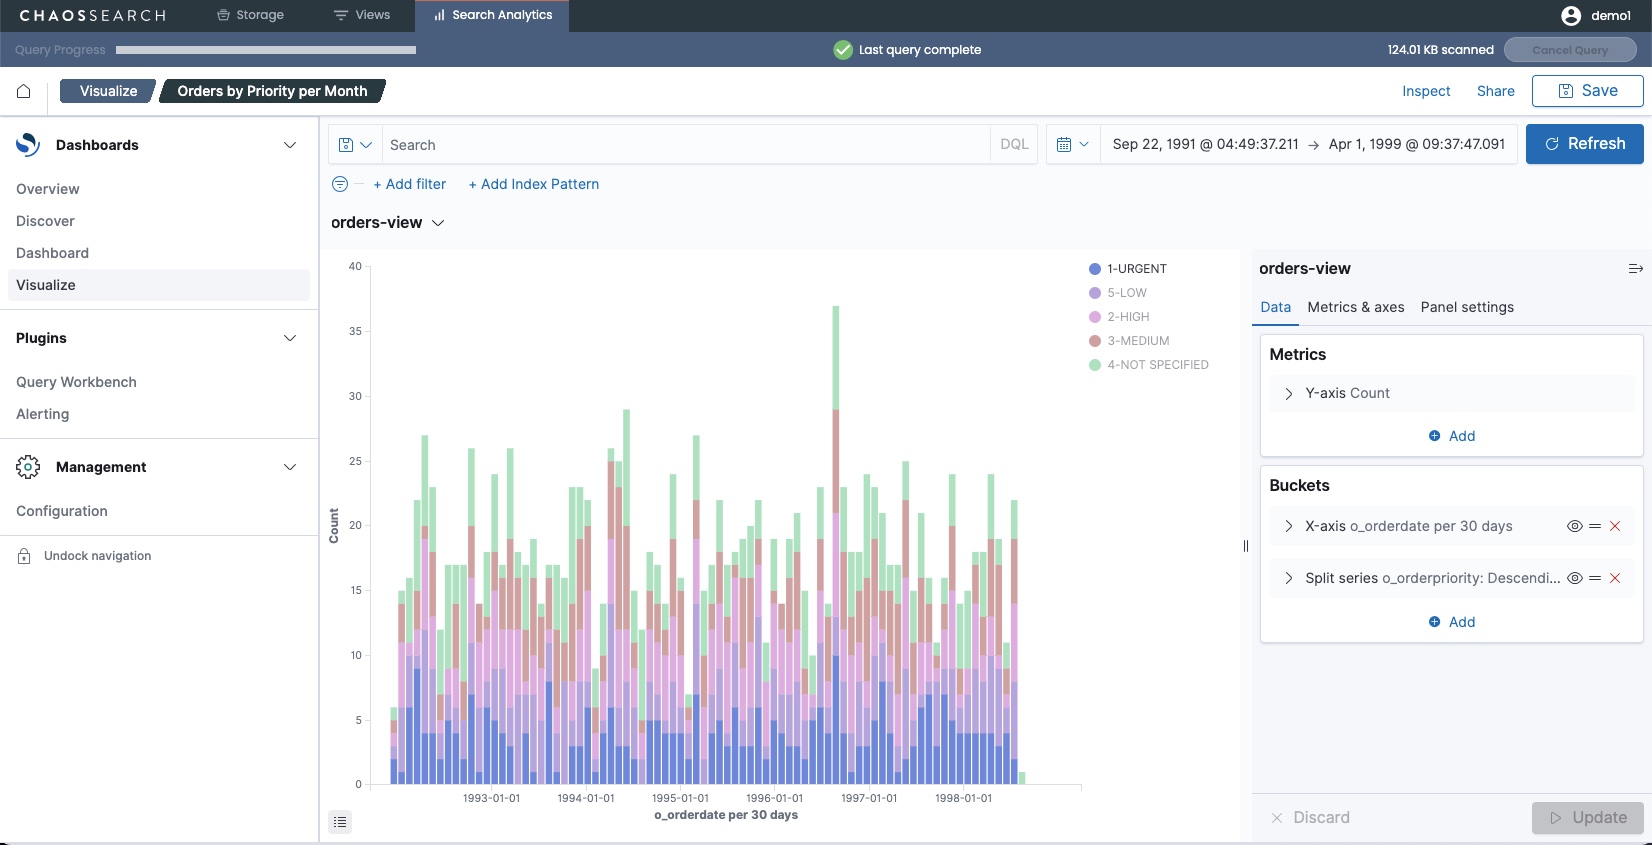
Click the Visualize or the Dashboard options in the left menu to see if there are pre-built visualizations that you can use for your data. The following image is a sample visualization of orders data showing a trend of orders by priority:
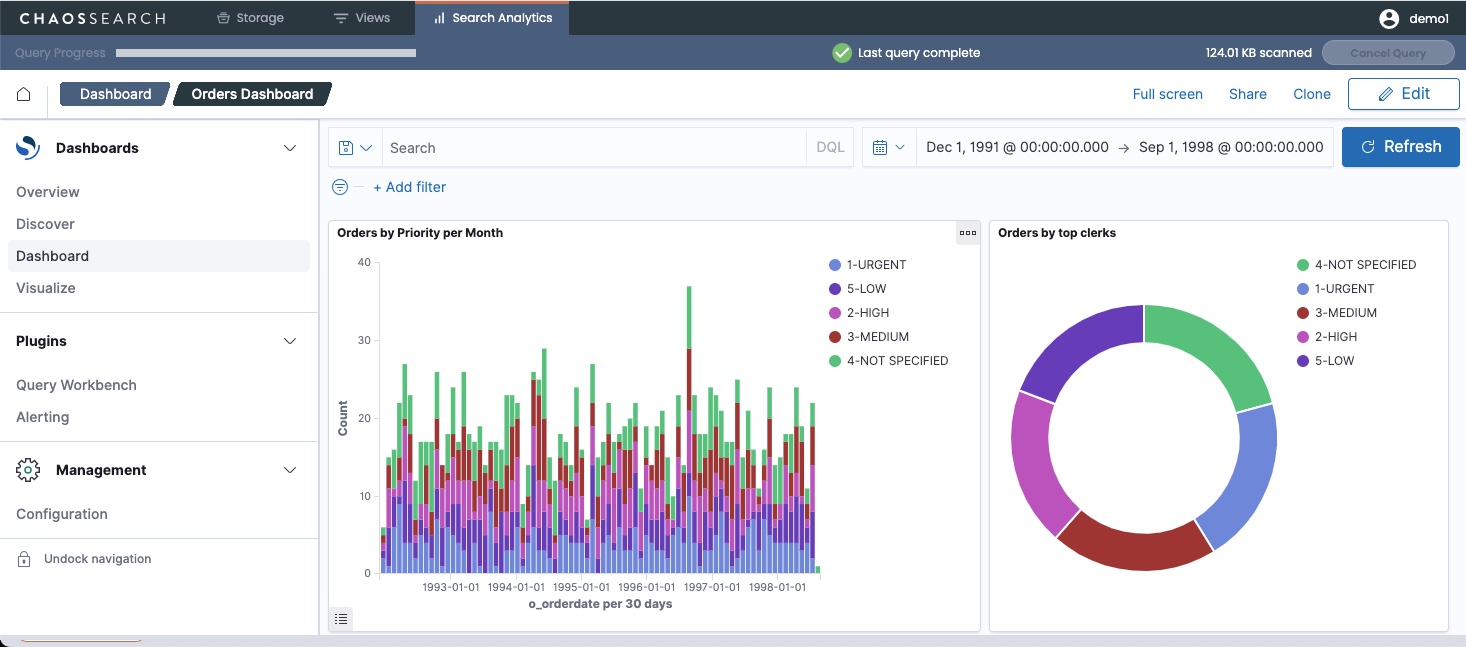
Dashboards combine multiple visualizations (either saved visualizations or ad-hoc ones created during dashboard development) on one page so that users can compare important factors for the data in a side-by-side summary. A sample dashboard for orders data follows with the bar chart visualization and another pie chart visualization:
Creating visualizations and dashboards can take some time and practice for new users to learn, especially for developing the analytics that support them. The OpenSearch Dashboards interface offers guidance to help with the process for creating them.
Updated about 1 year ago