System Dashboard
Use the System Dashboard to review high-level usage metrics and volume trends.
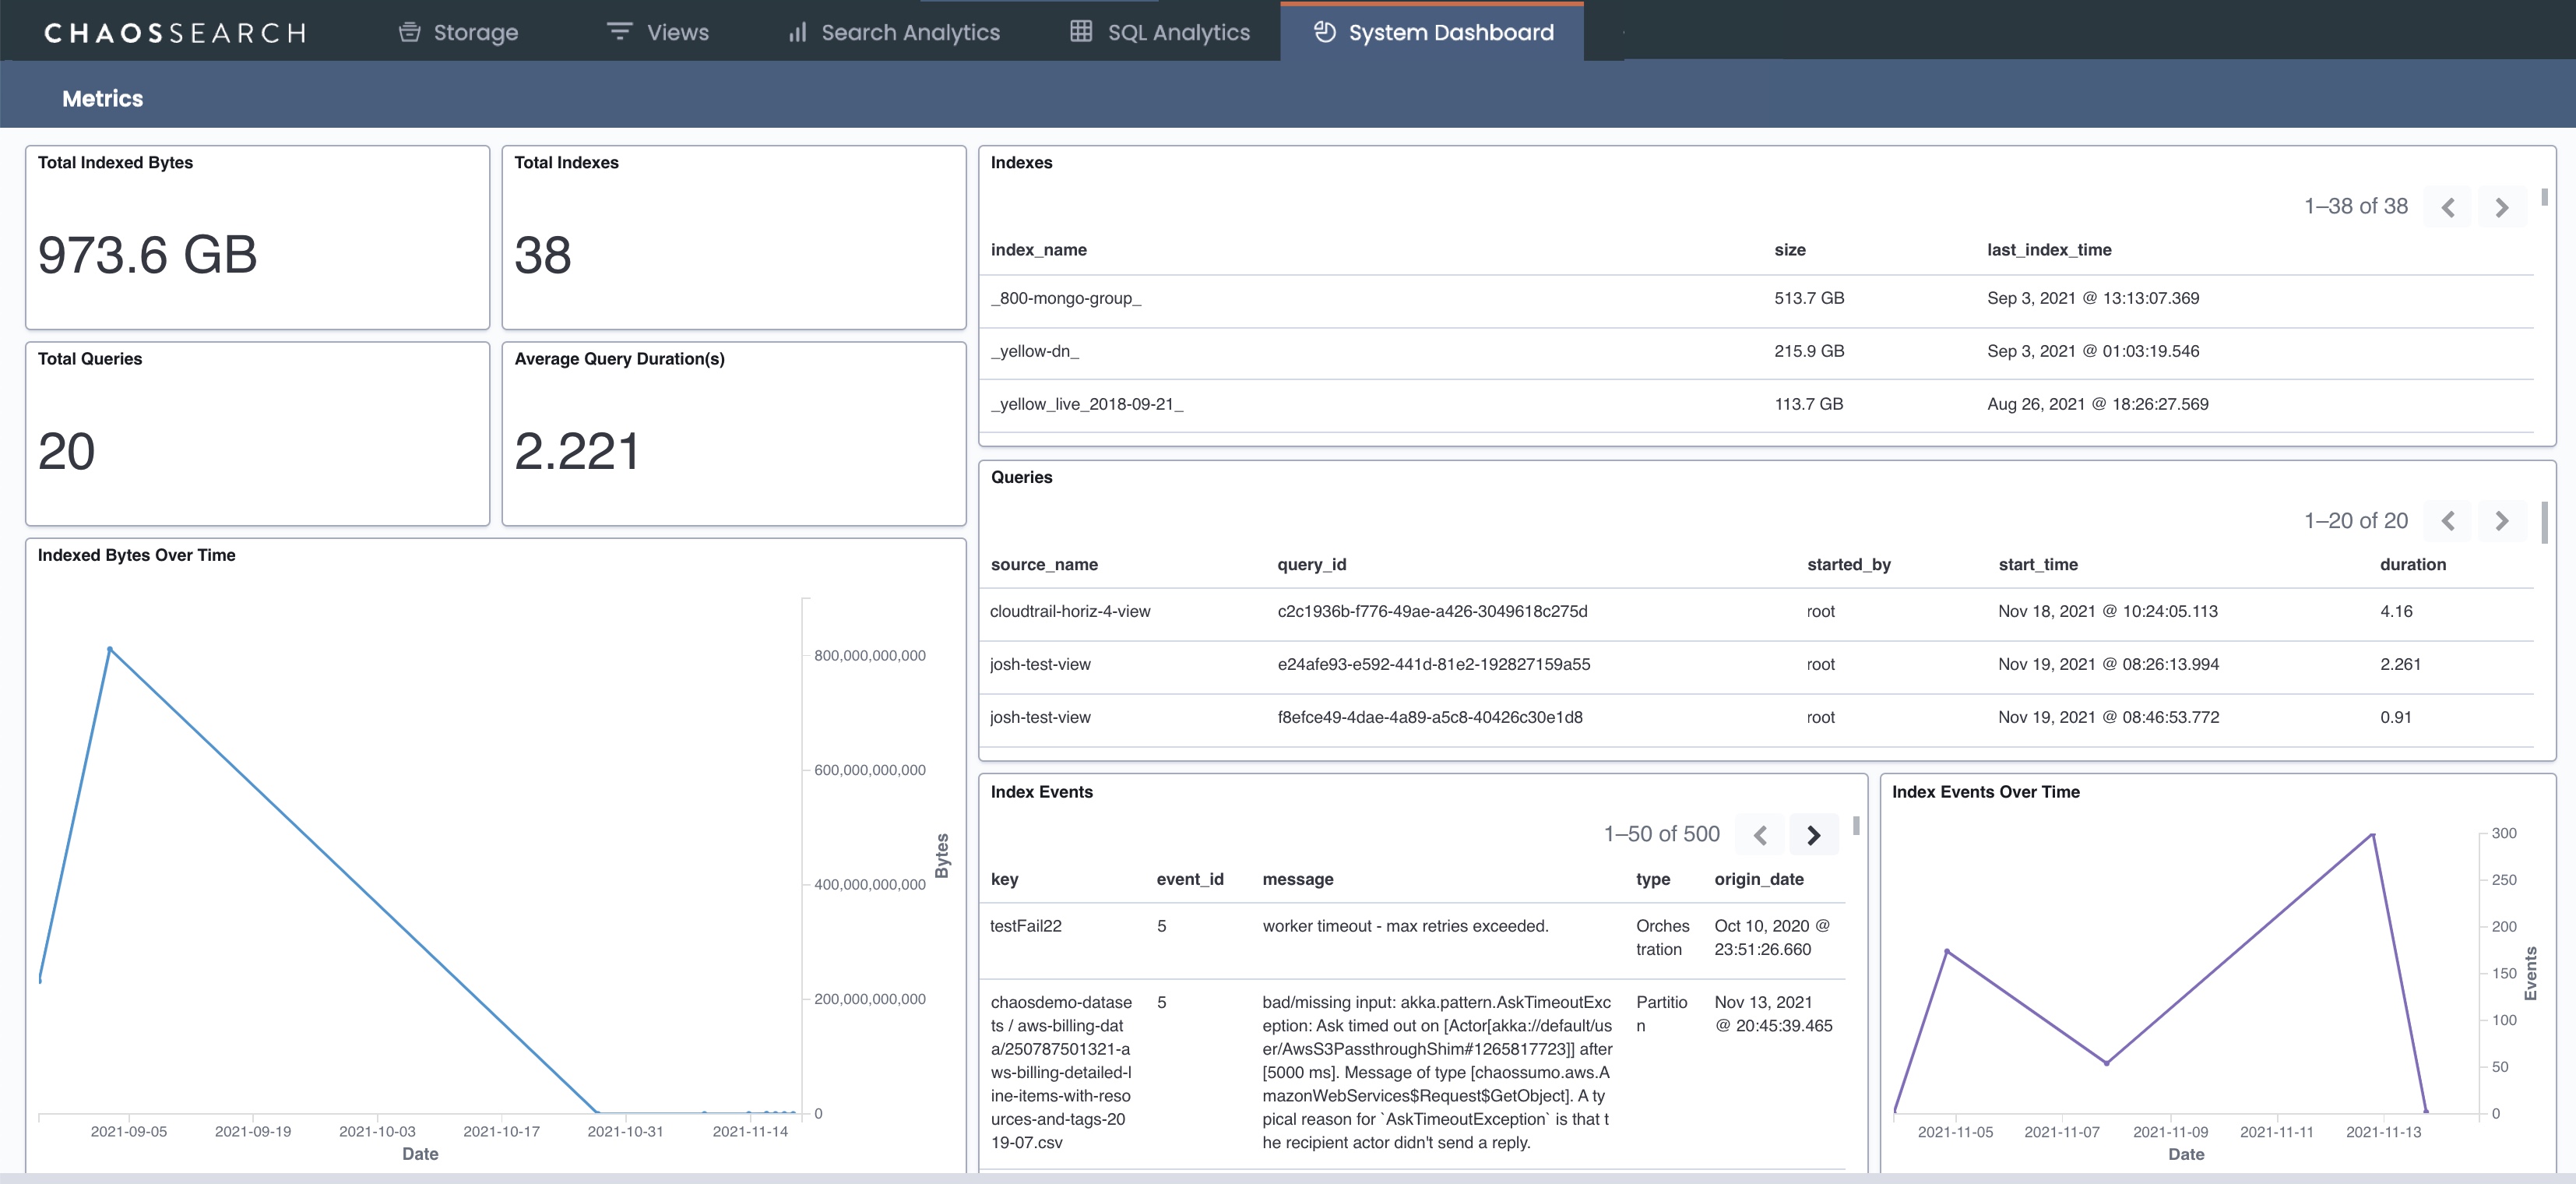
The System Dashboard provides administrators with a closer view of the user-level activity of the ChaosSearch system. This page can be enabled or hidden by RBAC permissions. It shows information about the indexing (total bytes, total indexes), queries (user and duration), index events reported for the system, and the trends for how those activities have changed over time.

The System Dashboard offers metrics about how an organization is using the ChaosSearch platform with the following charts:
Total Indexed Bytes
The total size of the indexed data for all object groups
Total Indexes
Number of object groups created
Total Queries
Number of queries executed by all users (This number is capped at 99 queries.)
Average Query Duration
The average time it takes to resolve a query; that is, the time it takes a search to complete
Indexes
List of all the object groups that have been created, their size, and last index time
Queries
List of all queries successfully executed, by which user, and the duration of that query
Index Events
List of system-generated events reported when the underlying data has no structure or structure cannot be created
Indexed Bytes Over Time (line chart)
The total size of the indexed data for all object groups for the last 90 days
Index Events Over Time (line chart)
The trend of the total events reported over the last 30 days
Updated 12 months ago
