Switch Views in a Search Analytics Visualization
Change the view for a visualization to see the new dataset in the panel.
In Search Analytics, while you are creating a visualization or when you are displaying a saved visualization, you can change the underlying view used for the visualization to see the data from an alternate dataset.
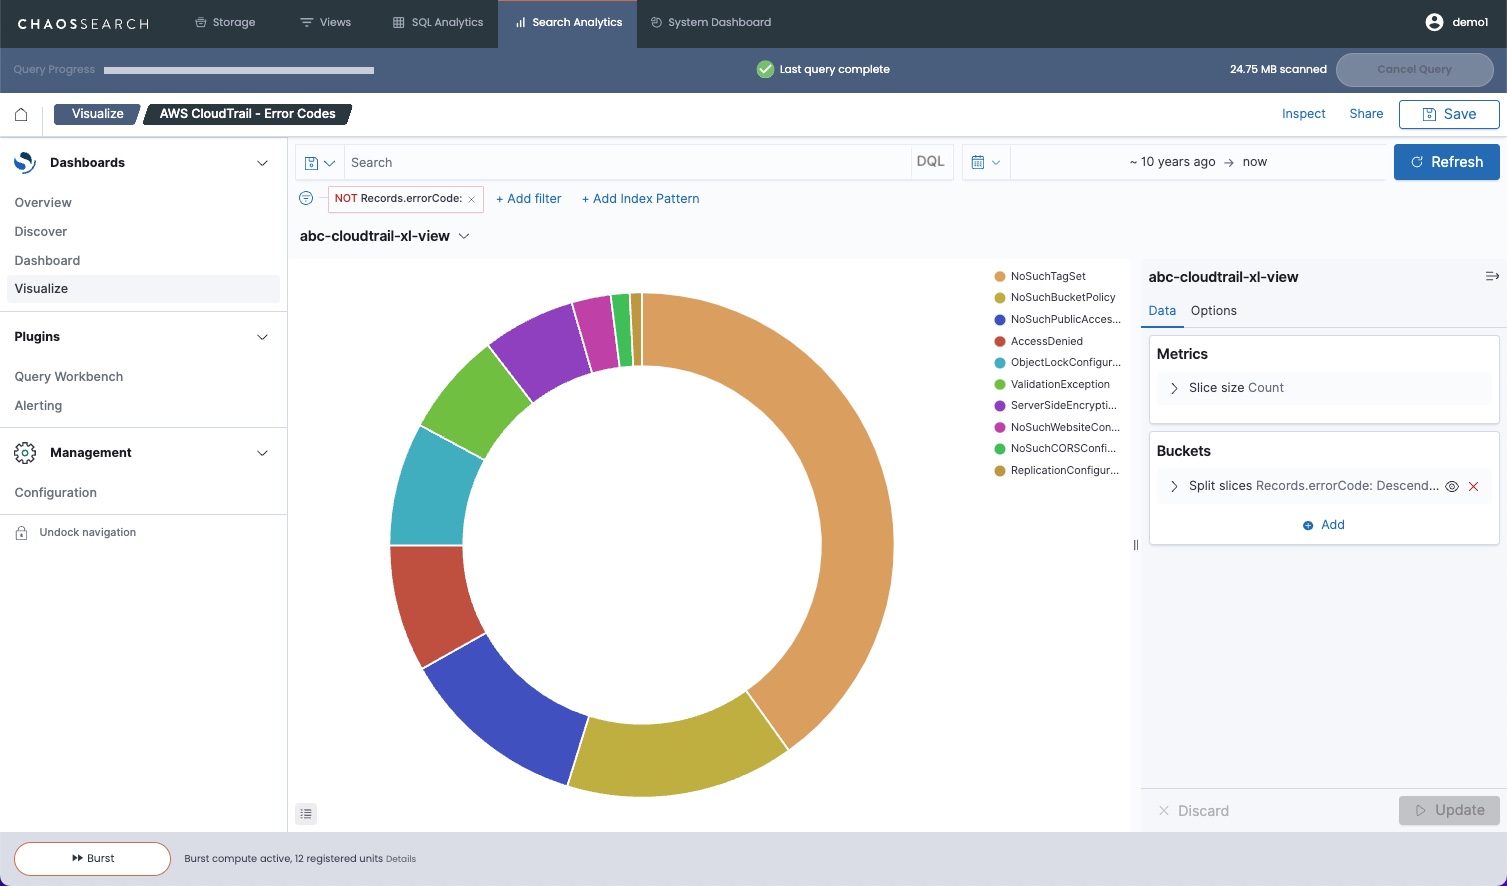
For example, the following visualization is a pie chart that displays all the non-null error codes in a CloudTrail view named abc-cloudtrail-xl-view.
To change the view for the visualization:
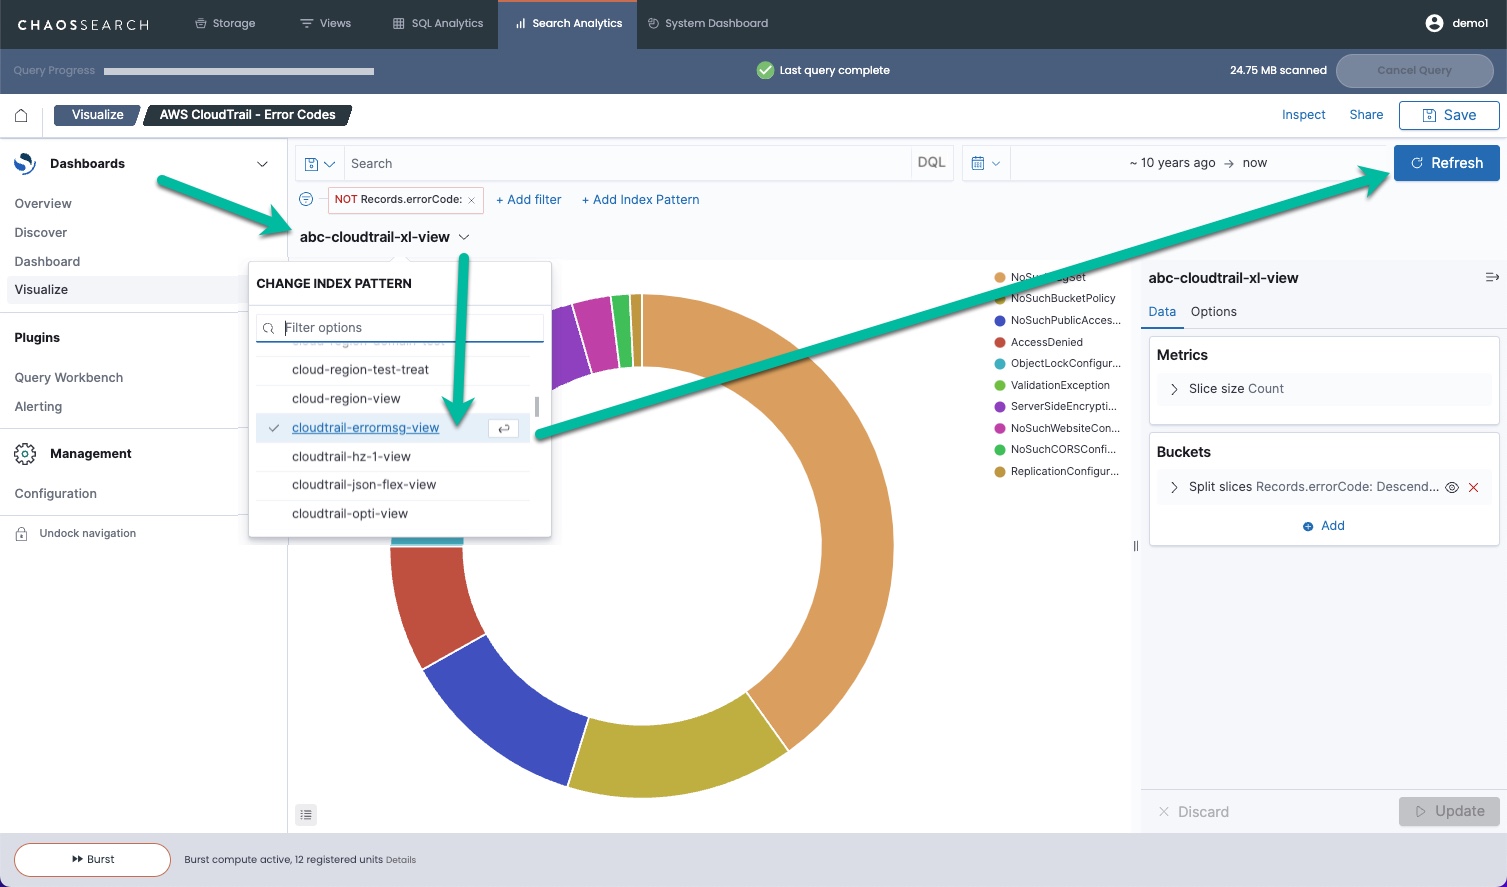
- Click the view name above the chart to open a view selection list.
- Select the new view that you want to use, and then click Refresh to redisplay the visualization.
- The updated view is displayed with the data for the new view:
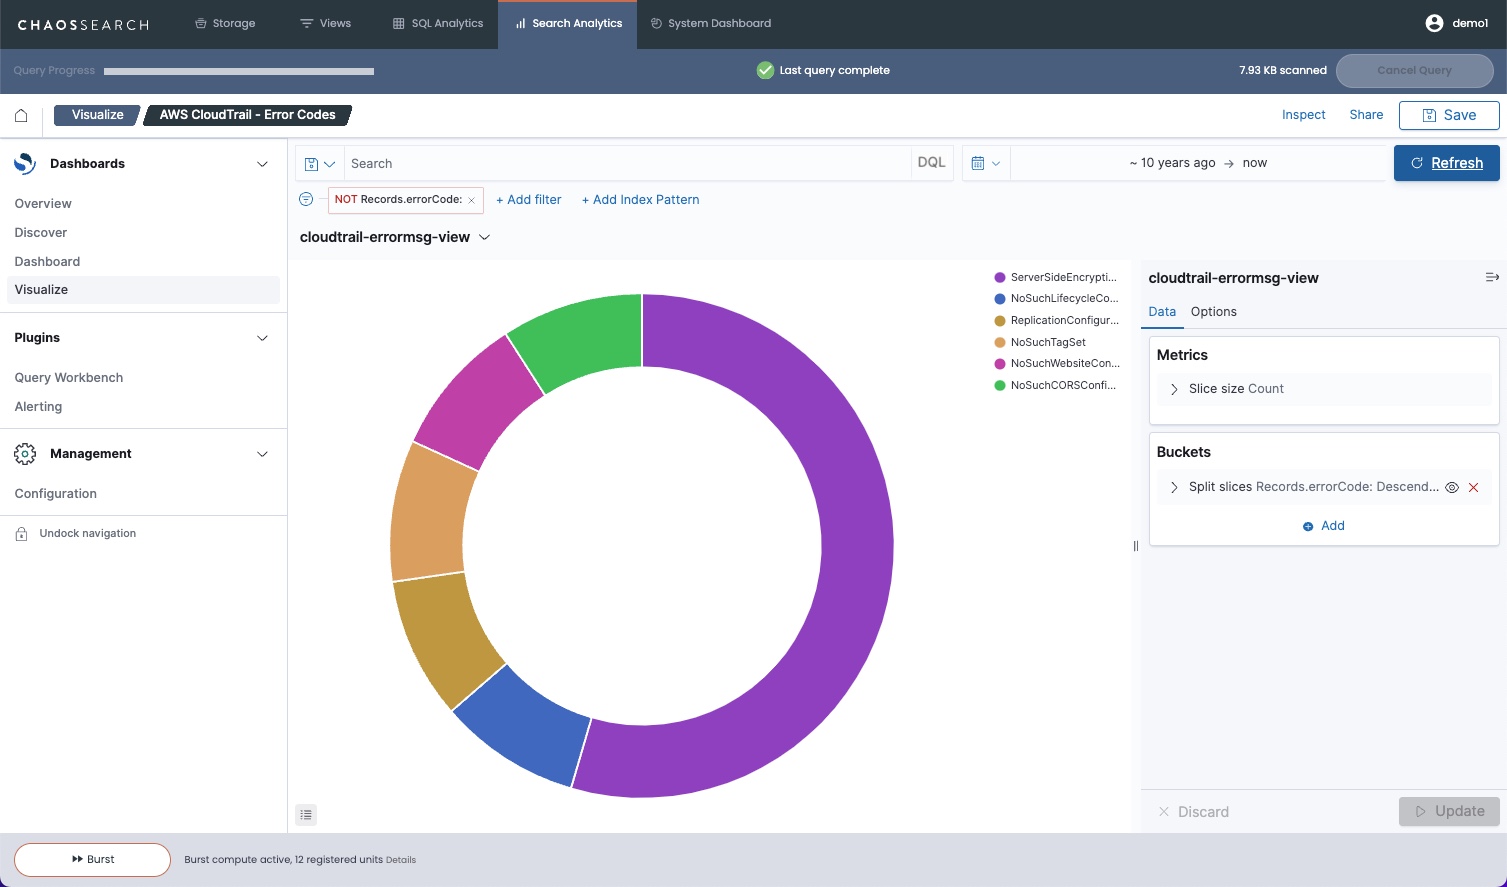
You can save the visualization with the new view, or create a new visualization with the new view.
Choose a view with the same schema as defined for the visualization.When you select an alternative view, make sure that the view has a schema that supports the defined field names, filtering, and grouping selections for the visualization.
If the new view does not have the required field(s) for the visualization, the system displays the message
Failed to load the visualization. Missing field "field_name". The window continues to show the previously selected view.
Updated about 1 year ago
What’s Next
Learn about visualization data formulas