Add Grafana Data Sources for Views
Configure Elasticsearch data source connections to drill-down to ChaosSearch searches and visualizations.
You define a Grafana Elasticsearch data source for each ChaosSearch view that you want to use for searches and analysis. The steps below reflect the Grafana 9.1.7 release version; other versions might have slightly different screens and steps.
Bulk View Configuration Options?If you want to connect many or all of your views to Grafana as Elasticsearch data sources, contact ChaosSearch Customer Success for information about bulk configuration of data sources.
Prerequisite Information
Make sure that you have the following information to create an Elasticsearch data source connection to a view.
- The ChaosSearch view name and the time field configured for that view
- The ChaosSearch user deployment URL (for example
https://mycompany.chaossearch.io) - An API Key ID and Secret pair for the ChaosSearch user
- The primary AWS domain for the ChaosSearch user (such as us-east-1 for example)
Create an Elasticsearch Data Source for a ChaosSearch View
The Grafana setup steps are to create an Elasticsearch data source for each ChaosSearch view that you want to use. The steps below reflect the Grafana 9.1.7 release version; other versions might have slightly different screens and steps.
To create a data source for a ChaosSearch view:
- Log in to the Grafana console at your site as an admin user who has permission to create data sources.
- In the left menu bar, click the Configuration (gear) icon, and select Data sources.
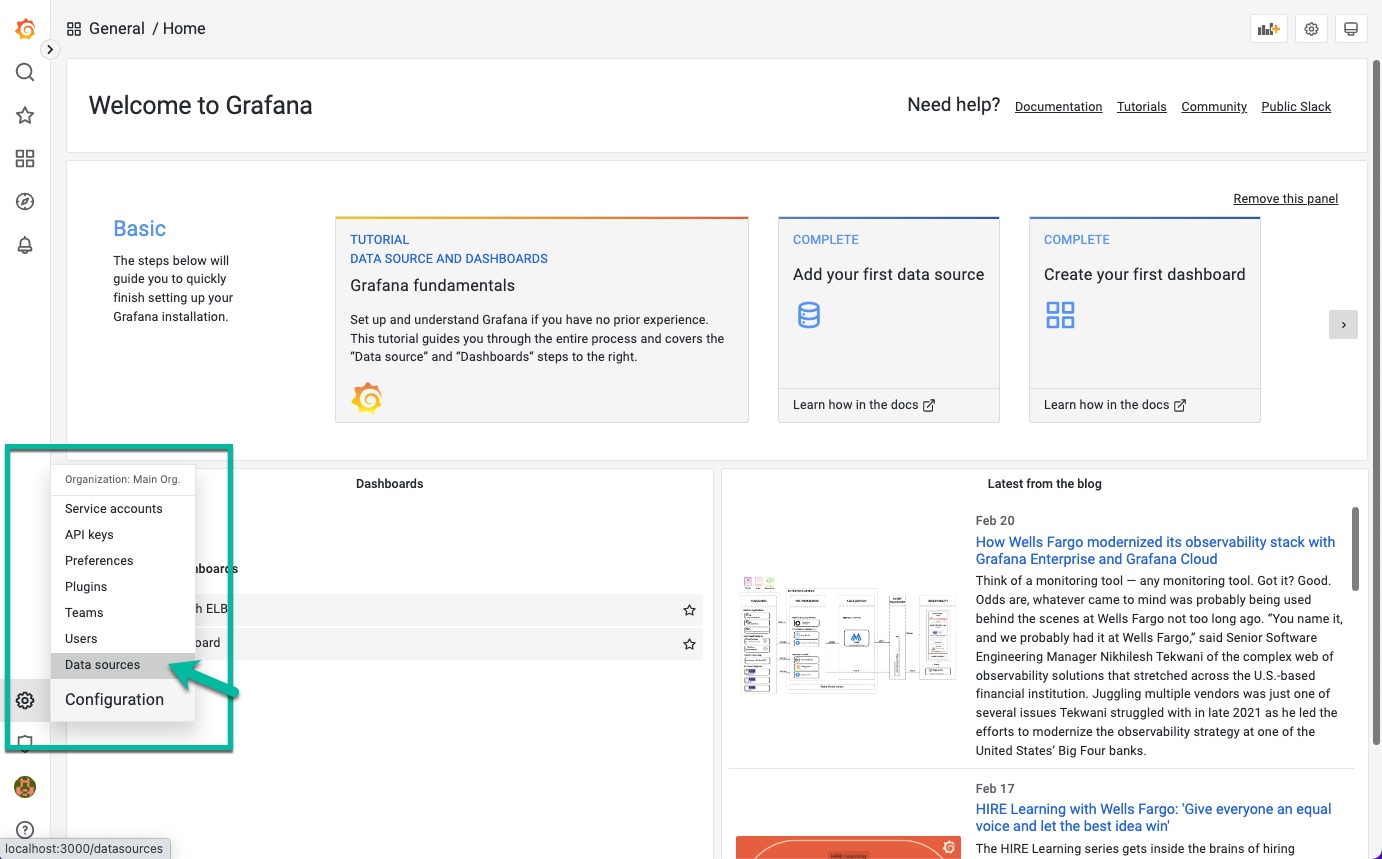
The Configuration Data Sources page opens.
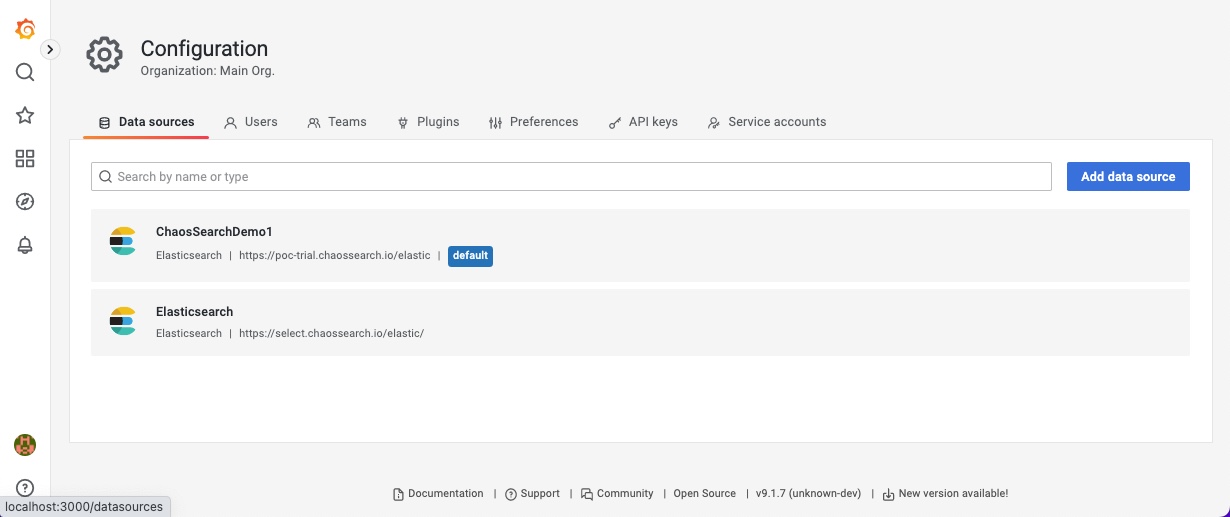
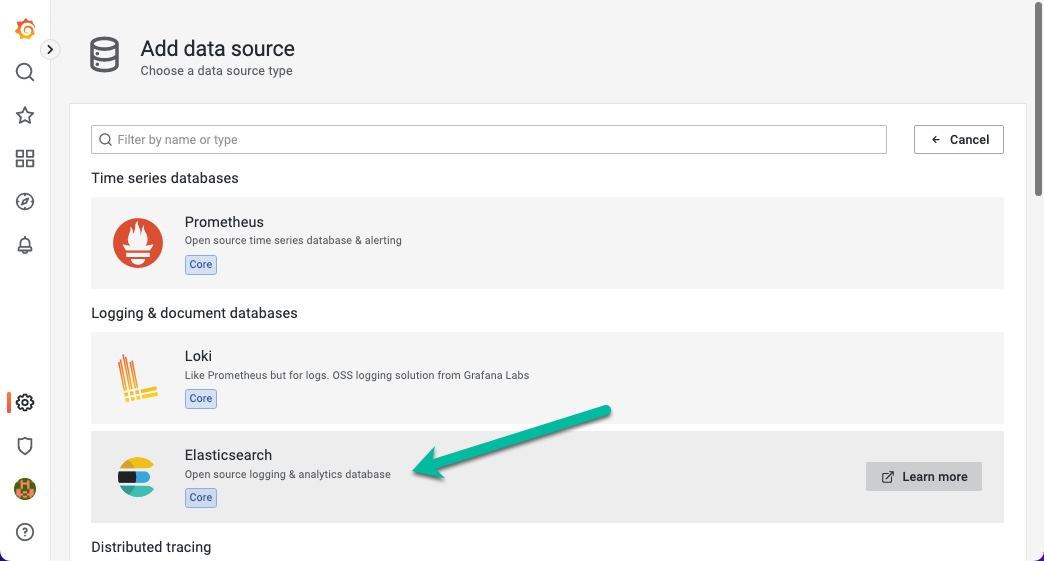
- Click Add data source, and in the list of data source options, select Elasticsearch.
- In the Data Sources/Elasticsearch window, verify that the SigV4 Auth field is visible on the page. (If it is not, see Grafana SigV4 Authentication Support and enable that support. You must restart Grafana and then repeat the steps up to this point to log in and create a data source.)
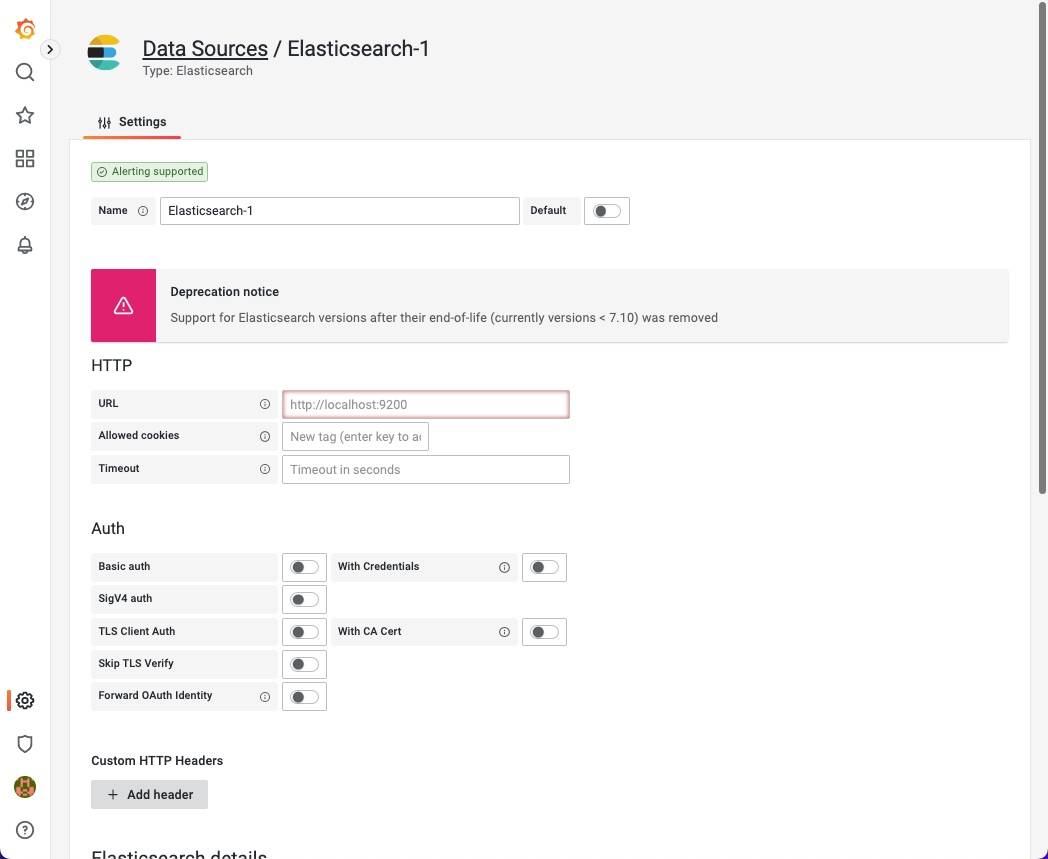
- In the Elasticsearch data source window, type in the following information:
-
In the URL field, type the ChaosSearch user deployment URL appended by
/elastic/, for example:https://mycompany.chaossearch.io/elastic/. -
In the Auth section (shown in the screen above), select SigV4 auth to enable that authentication format. The SigV4 Auth Details settings are displayed.
- In the Authentication Provider field, select Access & secret key.
- In the Access Key ID field, copy and paste the API Access Key value from ChaosSearch.
- In the Secret Access Key field, copy and paste the API secret value field from ChaosSearch.
- Ignore the Assume Role ARN and External ID fields.
- In the Default Region field, type the primary AWS region for the ChaosSearch deployment.
-
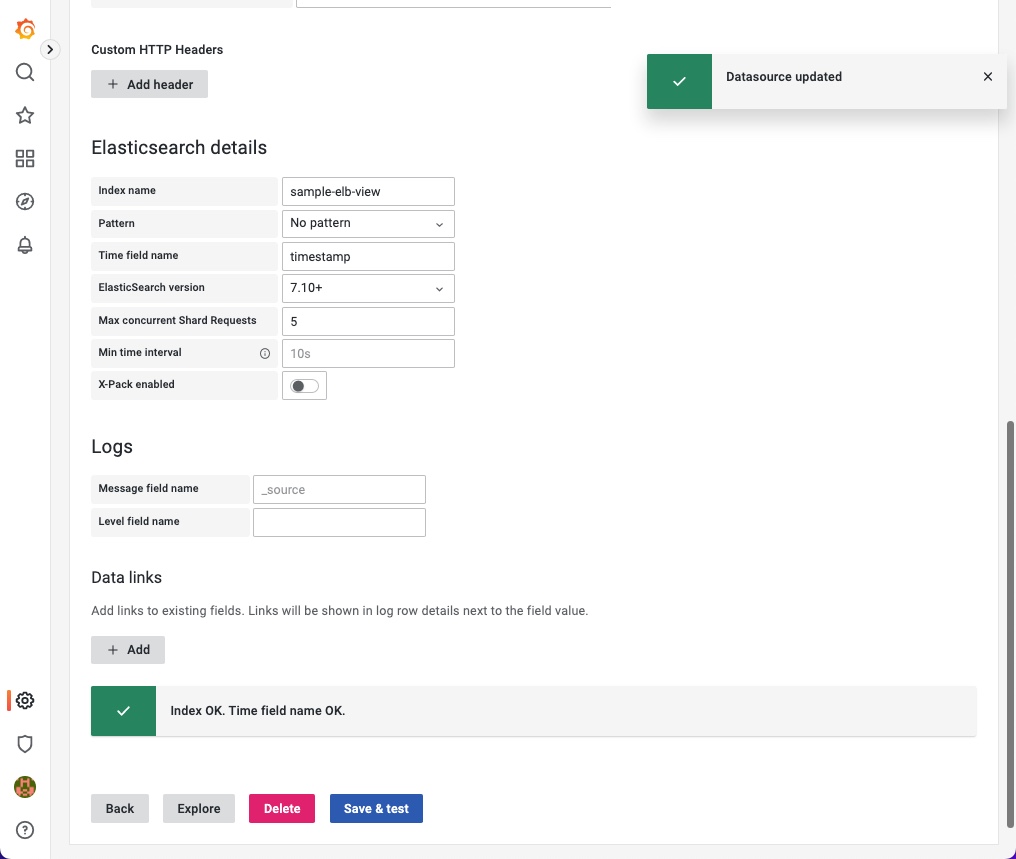
In the Elasticsearch details section (shown in the next screen) for the data source, type the following:
- In the Index name field, type the ChaosSearch view name.
- In the Pattern field, leave it as No pattern.
- In the Time field name field, type the name of the Time Column that was selected for the view.
- In the ElasticSearch version field, select 7.10+.
- Ignore the other fields for the details section.
- Click Save & test to save the data source information and to test the connection. You should see a green check mark with the string
Index OK. Time field name OK.
-
If you see a red caution icon instead of the green check mark, review the error message to determine the problem. Correct the information or settings for the data source and retry the test.
-
When you have a successful connection, you can start to use the Grafana features to create panels that show the data from your ChaosSearch view.
Updated 12 months ago
Create ChaosSearch data panels in Grafana.
