Create Dataset Metrics
Add custom calculations for your Superset visualizations
In a dataset, you can define one or more metrics to perform calculations with one or more rows of data. Metrics enable you to create:
-
Calculations based on a defined aggregation
-
Calculations to pivot rows to columns
Metrics definitions are stored as a SQL expression in a SQL statement for the dataset, but defined metrics are not available for use in the SQL Lab.
To create a metric:
-
In the Edit Dataset window for a dataset, click Metrics.
-
In the Metrics tab area, click Add Item.
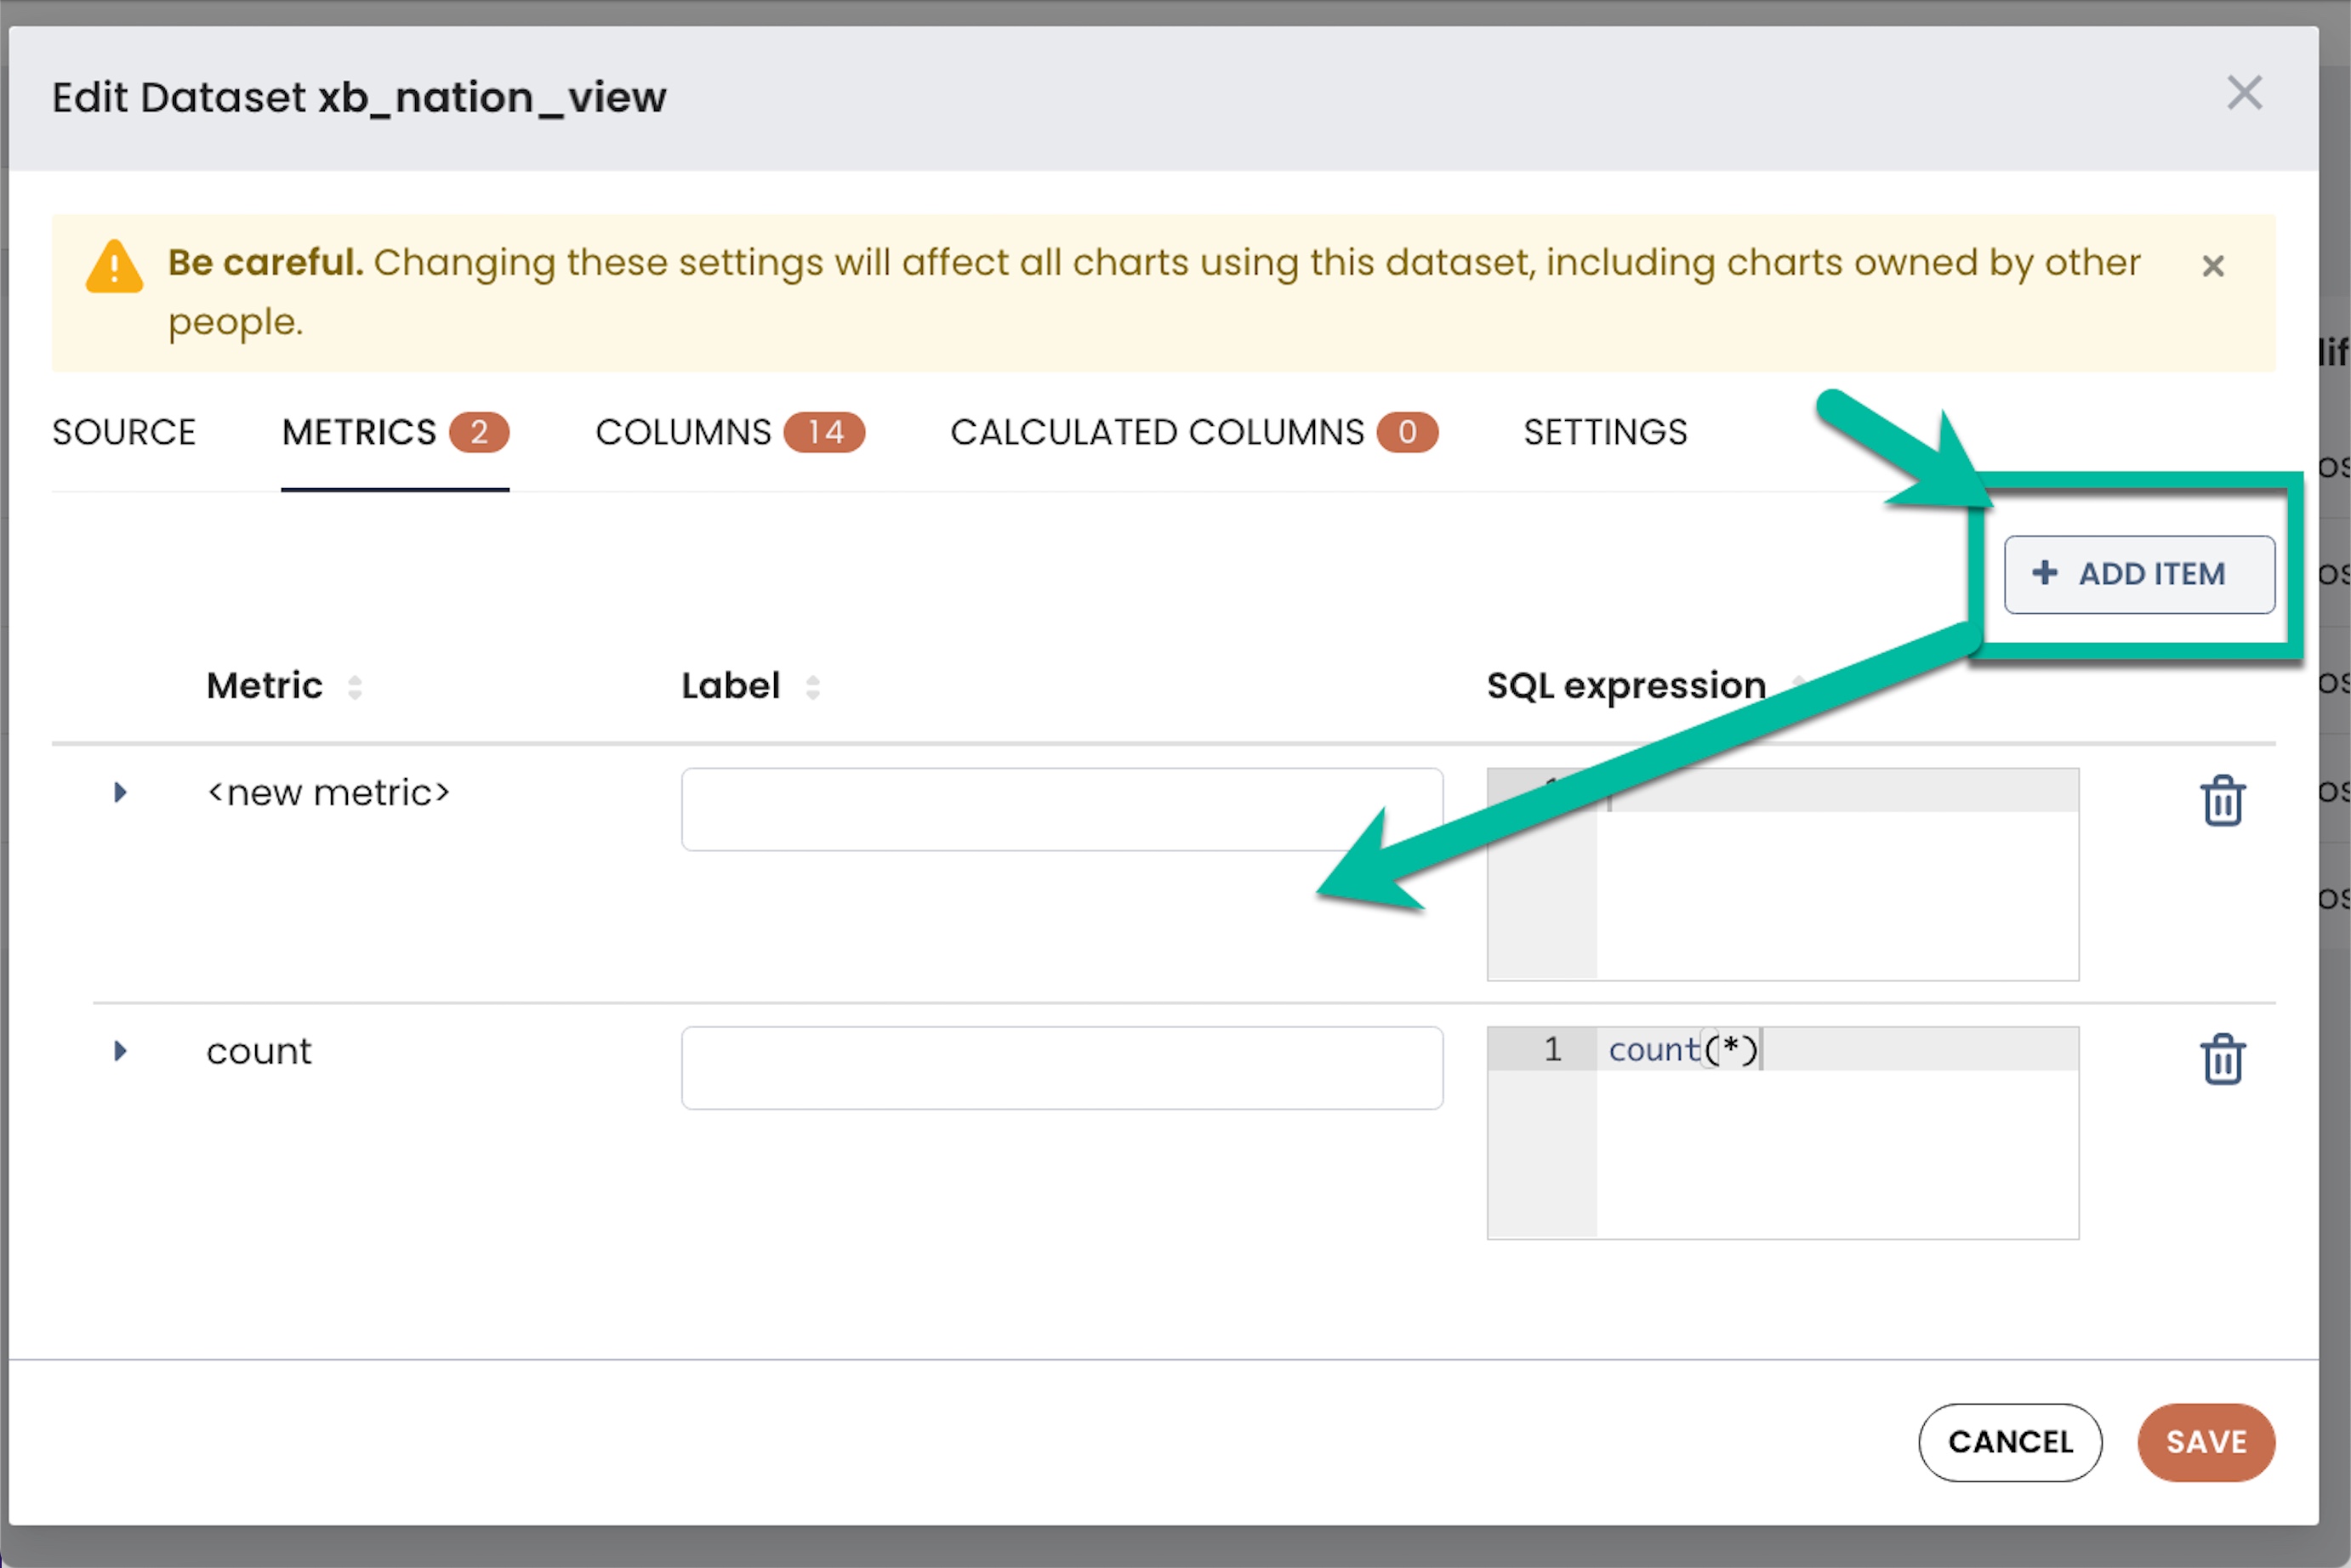
- Type information for the following fields:
-
Metric: The name of the metric
-
Label: The metric's label — this is the value that the user sees as the metric's name. Specify a unique label that clearly represents the metric information.
-
SQL Expression: The SQL expression that calculates the metric. This is the statement that computes the value of the metric, and it is also a tooltip when the user hovers over the question mark "?" icon.
- To edit other fields associated with the metric, select the expansion arrow on the left side of the metric row.
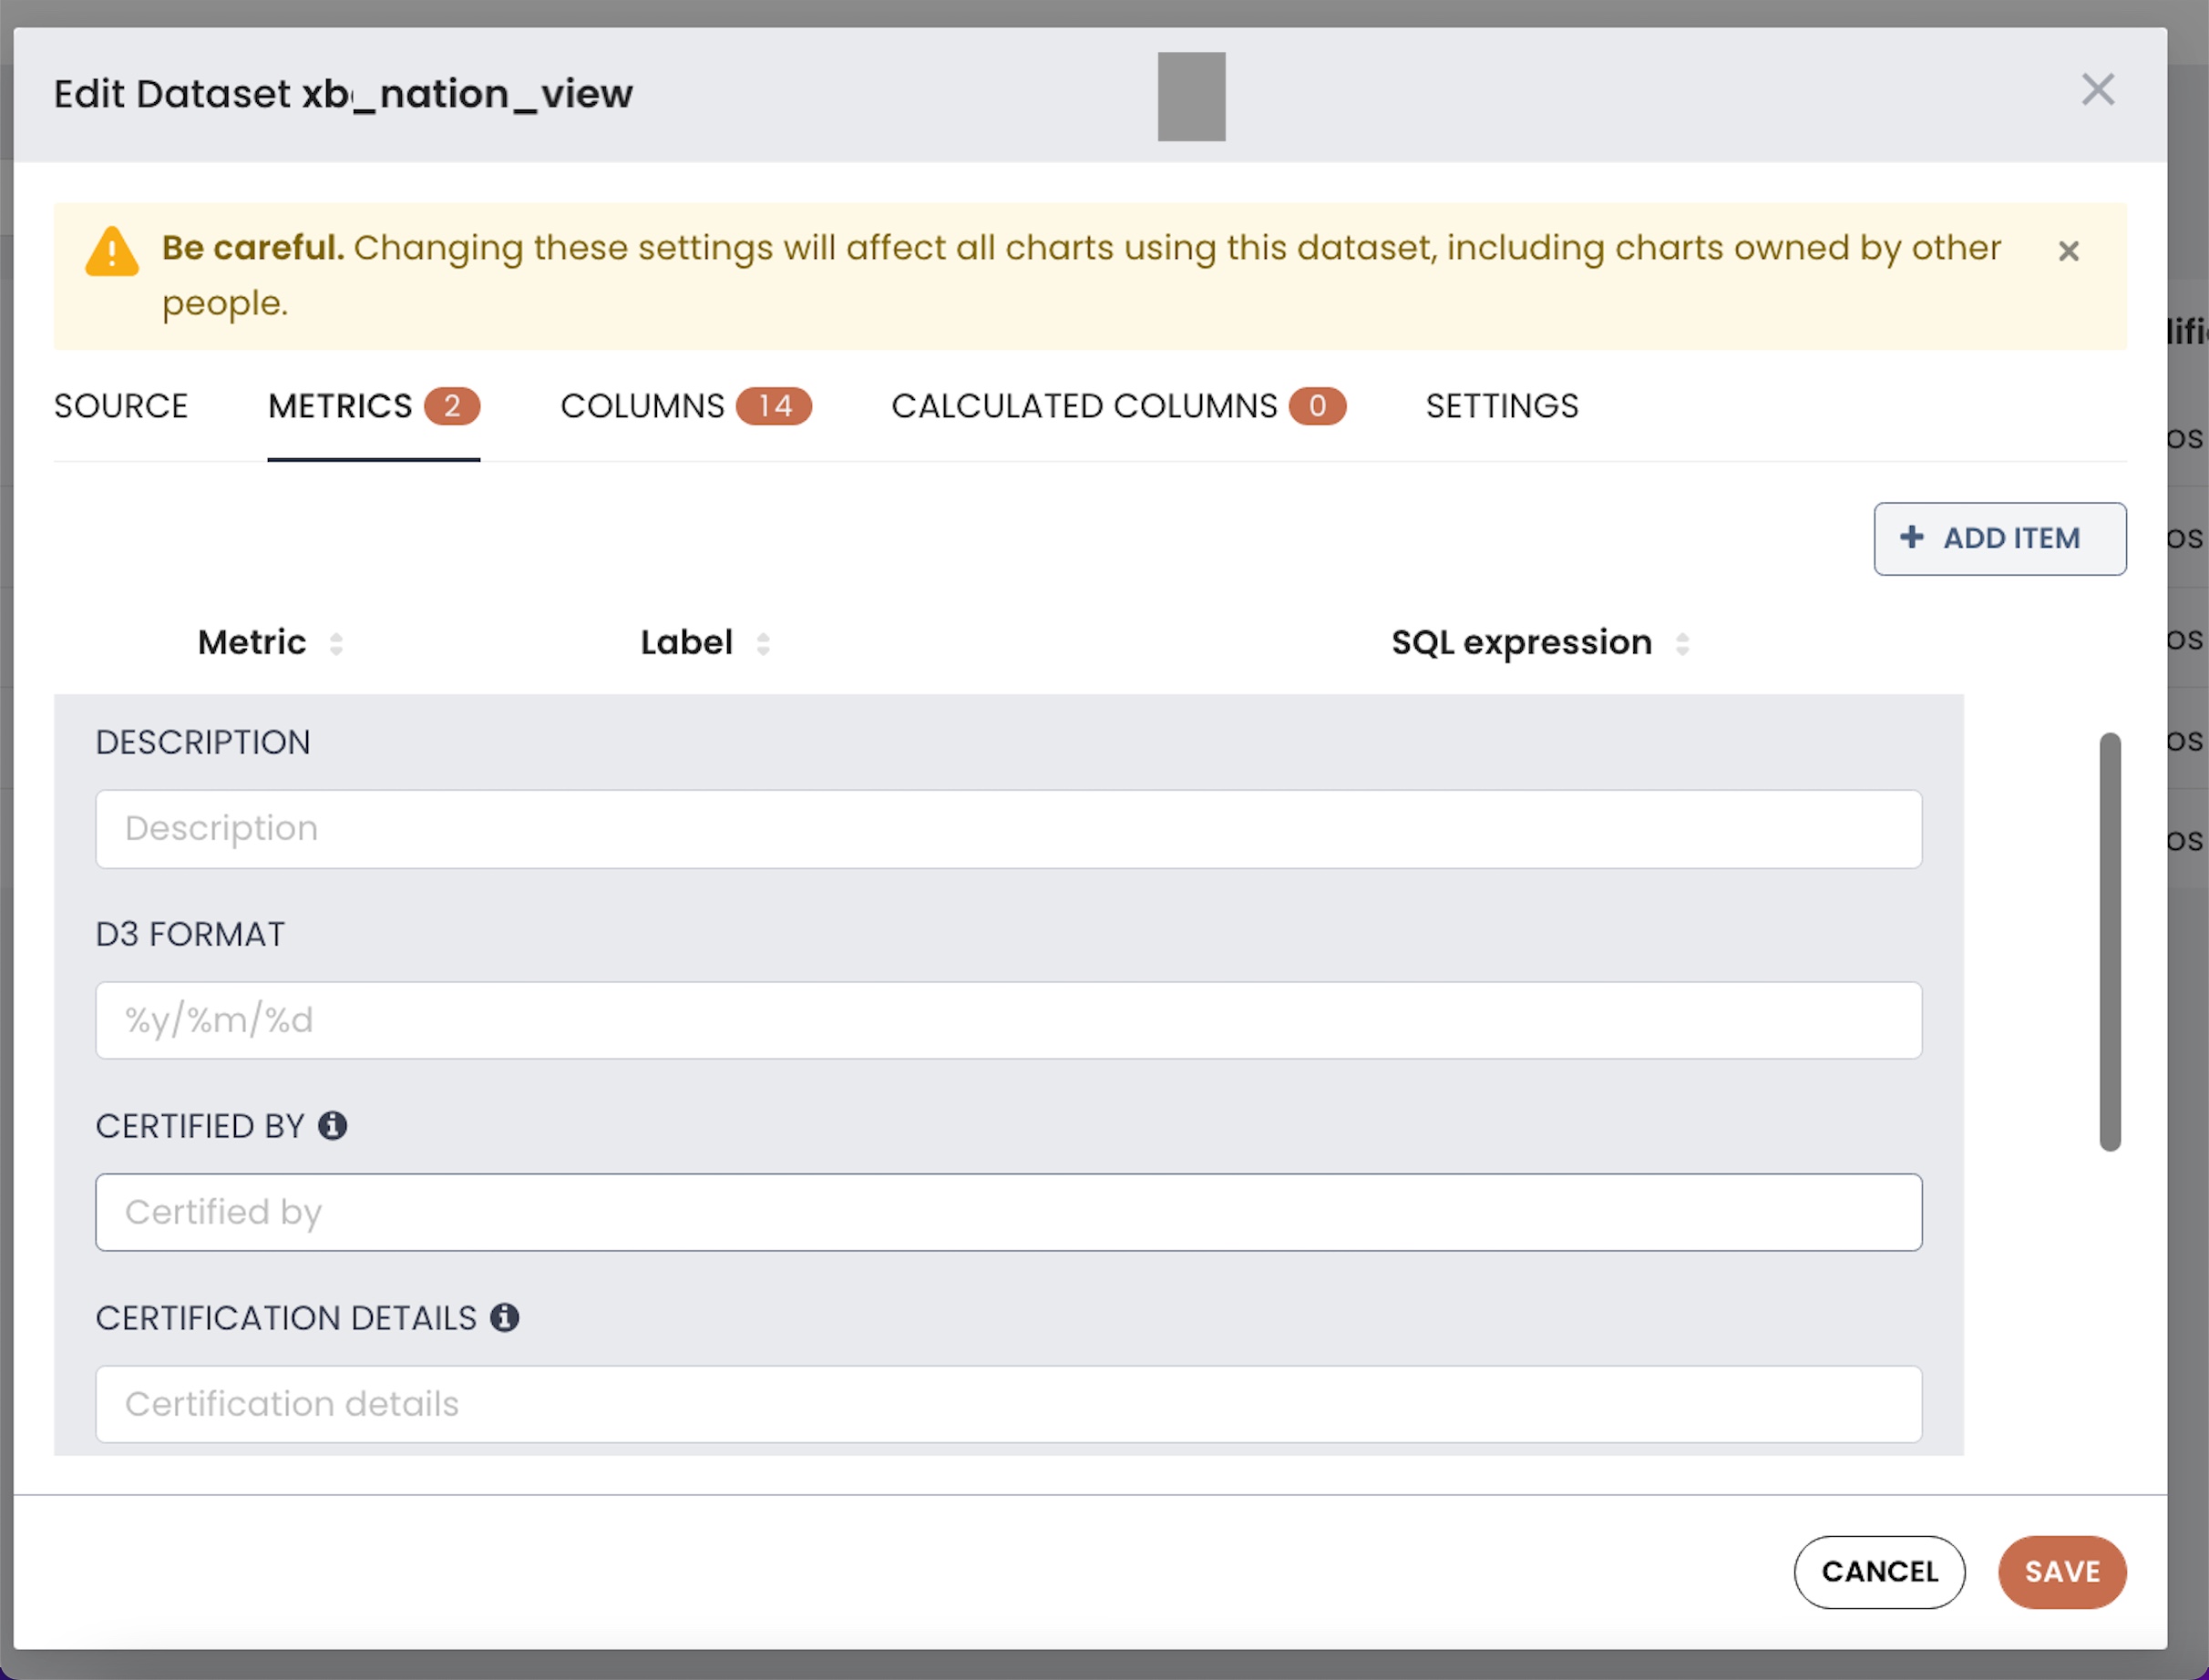
- For each metric, you can specify the following optional details in the expanded fields:
-
Label: A user-visible label for the metric's name (same editable field in collapsed metric row).
-
Description: A short description of the metric — this appears as a tooltip when the user hovers over the letter "i" icon.
-
D3 Format: Specify the D3-style number format to use for number fields. For example:
-
Given a value of 1234.567
-
.2%= 123456.7% -
.2k= 1K -
,.2r= 1,200
-
-
-
Certified By: You can specify a value for the person or team who certified the metric for use.
-
Certification Details: Any descriptive text about the certification details.
-
Warning: A warning message that, if defined, appears in the Metric selection field. Warnings can be helpful to note situations like when a metric has SQL runtime performance implications, or might be in a “beta” mode and to be used only in test charts or dashboards.
- Click Save.
Updated about 1 year ago