Searching the Indexed Data
Use Discover to search within a view for information and insights.
Search Analytics Discover page searches are often the first step for queries on newly indexed data, or when users "hunt" to find very specific details in their log and event files. When you click Search Analytics in the ChaosSearch console, the Discover page opens and you can start to search with ChaosSearch views.
A sample discover of an ELB logs view shows the basic steps to select a view, select a timeframe, and then watch for the results:
In the Discover results, note that there were 1 million hits. The hits value is the number of matching records (in this case, all the records) for this particular search. A wide search for a short period of time can be helpful to fetch sample results, but it is more commonly the case that users want narrower searches to see the results for very specific criteria.
Below the histogram, Discover returns a detailed view of up to 500 records (the default configured setting) from the matching hits. This is a random 500 records from all of the hits. The records provide more information for users to examine with additional columns of information.
The number of returned records is limited for performance, and can be increased or decreased after consultation with ChaosSearch. The QueryResultSizeLimit service limit can be used to limit the maximum number of result records to return in a Discover query run from the UI. Consider using the Bulk Export option for queries that could return more than that result limit.
Hits, Results, Documents...Hits, results, records, rows, documents, and data are synonyms for the information returned in a search of the indexed data associated with a Refinery view. Elastic uses the term document (or doc) for the unstructured content that it searches and for a matching result returned in Elastic queries. Search Analytics uses hits as the number of items found in a discover/search of content. SQL uses rows (and columns) for the information returned in SQL SELECT operations, though the term record is sometimes used. All of these terms are used in the ChaosSearch documentation to be flexible with the supported UIs, APIs, and possible integrations with third-party apps that might use these or other terms for results.
Searching One or More Views
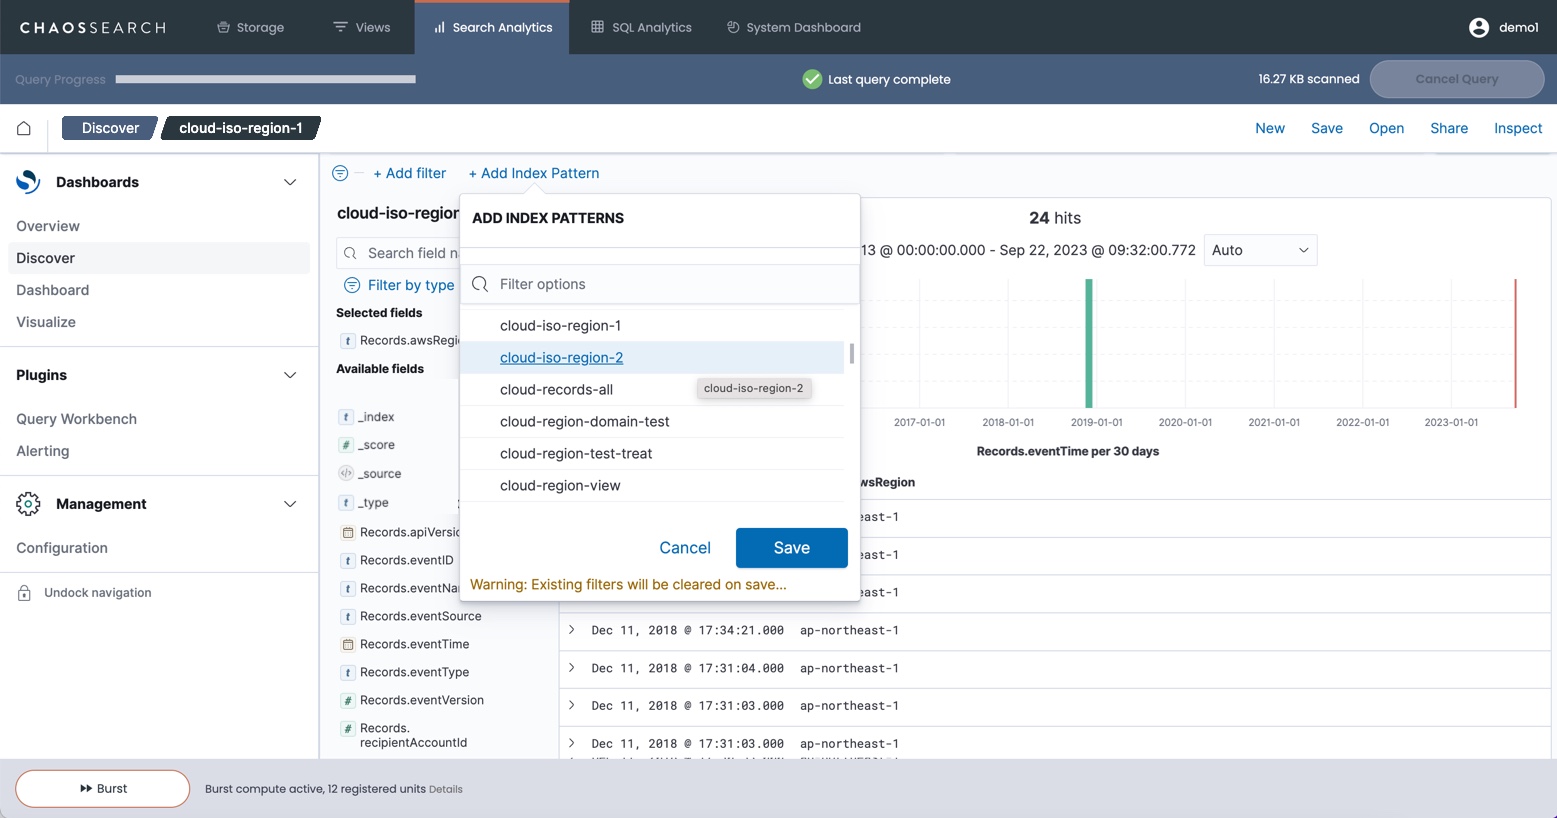
You begin the Discover process by selecting a Refinery view to search in the drop-down list. Typically you select one view, and if desired, you can add views to the search using the Add Index Pattern option. The following screen shows a Discover result set of 24 records for the view cloud-iso-region-1 and the Add Index Pattern option to add a second view cloud-iso-region2.
The following screen shows how adding the second view with the data for region 2 returned more results with the additional records for the second region:
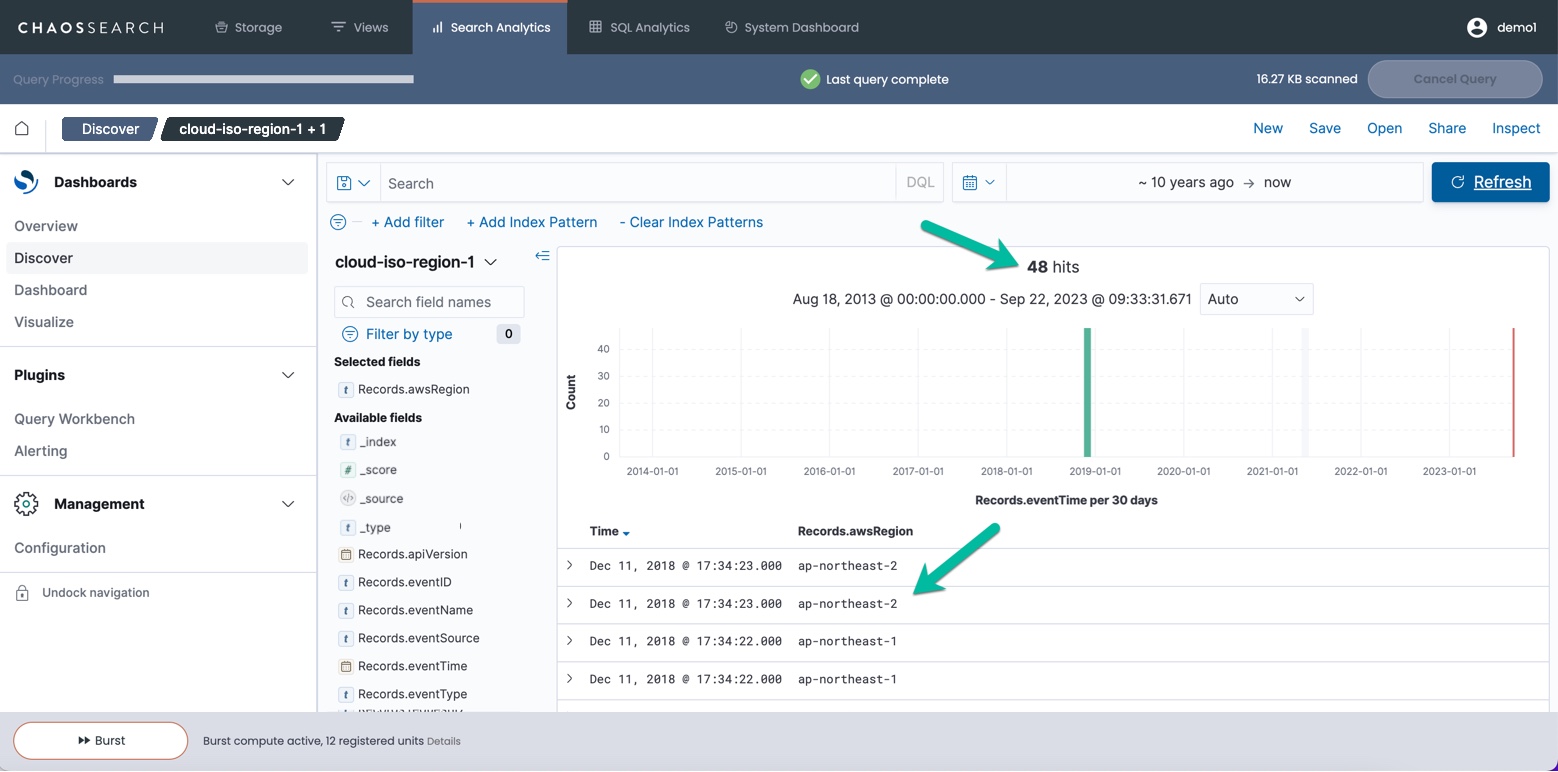
Note the +1 after the view name of the breadcrumb trail at the top of the window to denote that there is an additional view in the search. You can clear any selected additional views and return to the single view by clicking Clear Index Patterns.
The multi-view feature is helpful in cases where similar data is organized using different views. For example, users might have a view for live log data, and another view for historical/static log data that was archived to cloud-storage weeks or months before. Some organizations might have unique views of similar data for a specific team or region. With multiview, you can select one view in the drop-down list (the primary view), and select additional views using Add Index Pattern. Discover will search across all selected views for the specified criteria and time range.
Some important points about multi-view:
- Use views that share a common schema of columns and data.
- The Discover page areas for Selected fields and Available fields are based on the primary view. While the additional views should have similar columns, the list does not update to show a union of all columns.
- Any existing filters for the currently selected view are cleared when you add another view. You must specify the filters for the new search.
- The query returns up to 500 (configured default) records per view. If you query two views, for example, Discover returns up to 500 matching records from each view, for a maximum of up to 1000 records. In the example above, only 48 matching hits were found, so all 48 matching records are returned.
Search Your Data
Discover includes some very useful options for creating refined queries, and for filtering the result output. There are three basic search types in Search Analytics:
- Free text searches – run a wide search for important values (powerful, but usually not the most efficient)
- Field-level searches – search specific fields for values of interest. You can use Dashboards Query Language (DQL) to refine the results.
- Filter-based searches – search fields with UI filtering controls that can help to narrow the results
The Search Analytics/Elastic applications also include support for wildcards, ranges, and regular expression matching options.
Incremental Query Results
When your Discover searches process a very large number of results, ChaosSearch loads the results incrementally until the results are complete. An example follows:

With incremental loading, the Discover results update periodically while the search runs (note the Query in Progress status), and then stop loading when the query is complete. In this way, analysts can start to see the results right away rather than waiting many seconds or possibly a minute for the complete set of results to be returned. (The incremental update behavior is an optional feature, and the increment result set size is configurable as a system setting. Contact your ChaosSearch Customer Success representative for more information.)
Explore Result Details
The histogram shows a timeline of the results or hits (when a view has time-based data). The results panel below the histogram shows more details about the results. By default, the results are an abbreviated summary of fields (and possibly partial fields for very wide columns). Click the expand button (carat) on the left of any row in the search results to view more information about the record data as a table. Click the carat again to collapse the information back to the default view.
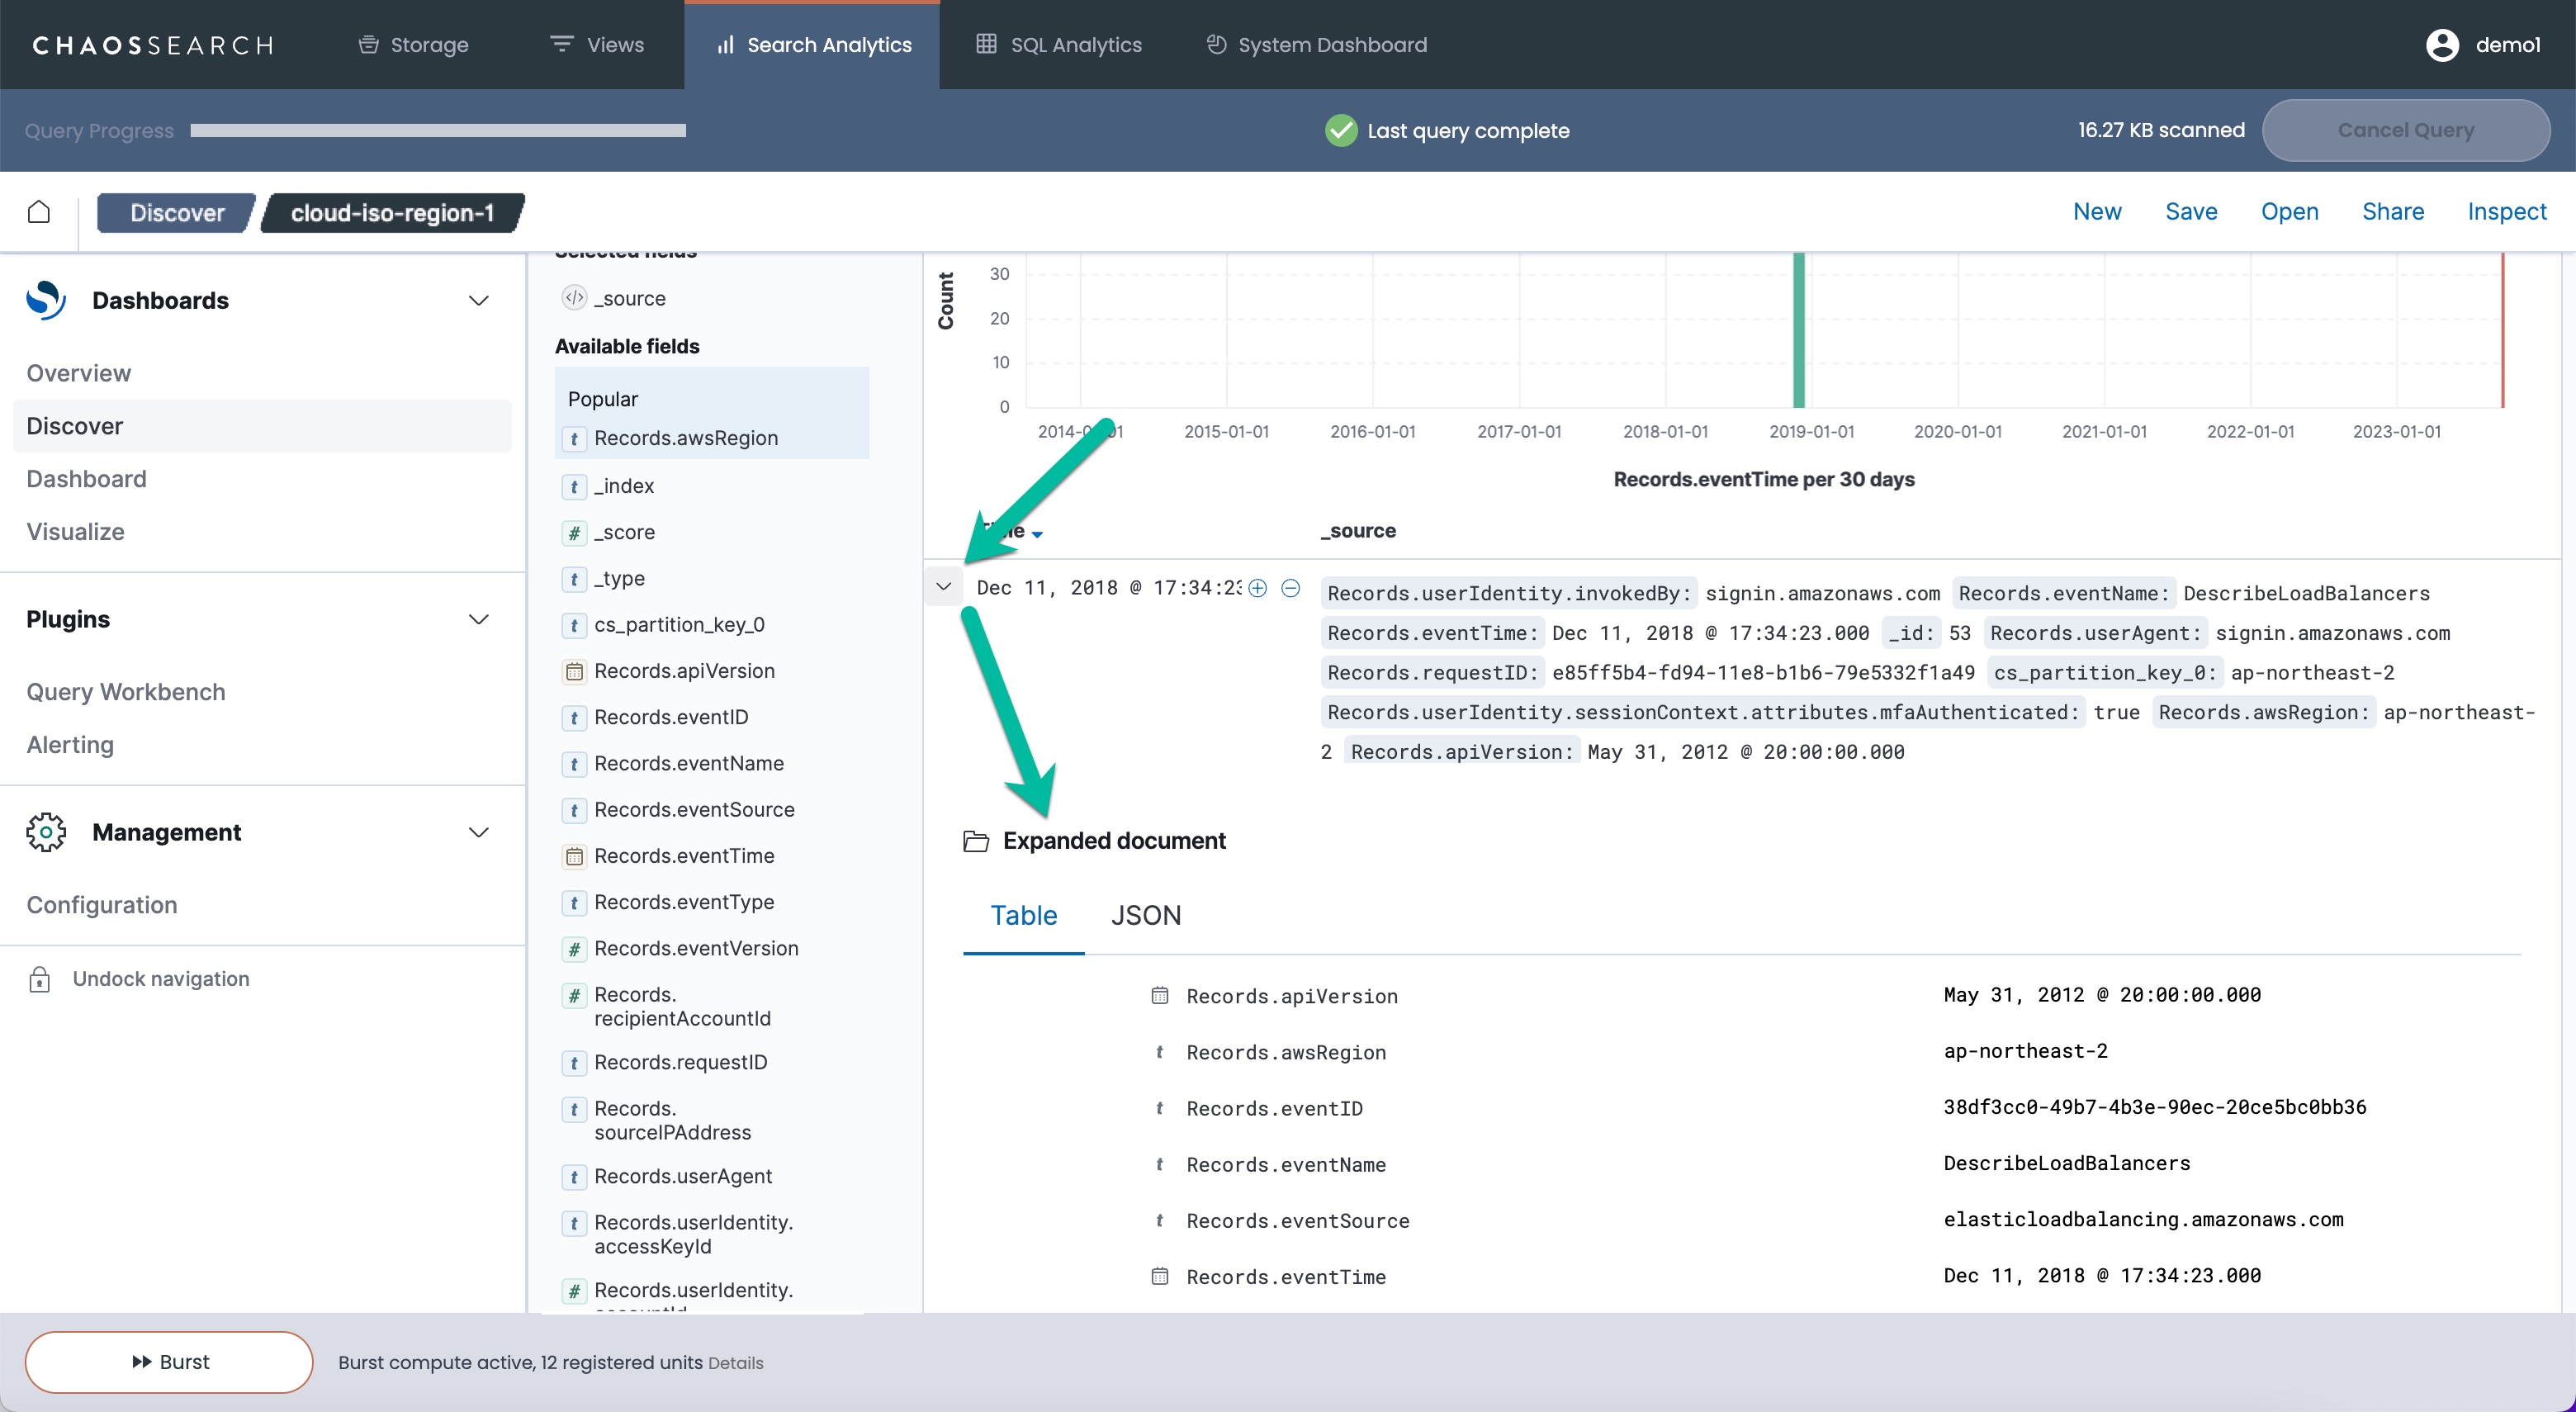
By default, the data is displayed in a tabular format. To view the data as a JSON object, click the JSON tab.

To view surrounding documentsIn the ChaosSearch implementation, the Elastic-style View surrounding documents option is not available. To display the surrounding results, update the Discover search to remove the strict constraint you applied (for example, a
messagefilter), narrow the time range to the record of interest, and keep the filter that you want to use to see the surrounding results (such as,hostname).
Filtering the Record Display
As shown in the previous examples, the results information could be very wide for some logs and events sources. You can use the Available fields selections in the left list to select one or more columns that you want to display for the results, which can help to focus on key pieces of information. For example, for the ELB log data, you can use the left controls to show only a subset of columns like cs_uri_stem. Hover over the field and select the plus icon to add another field to the display.
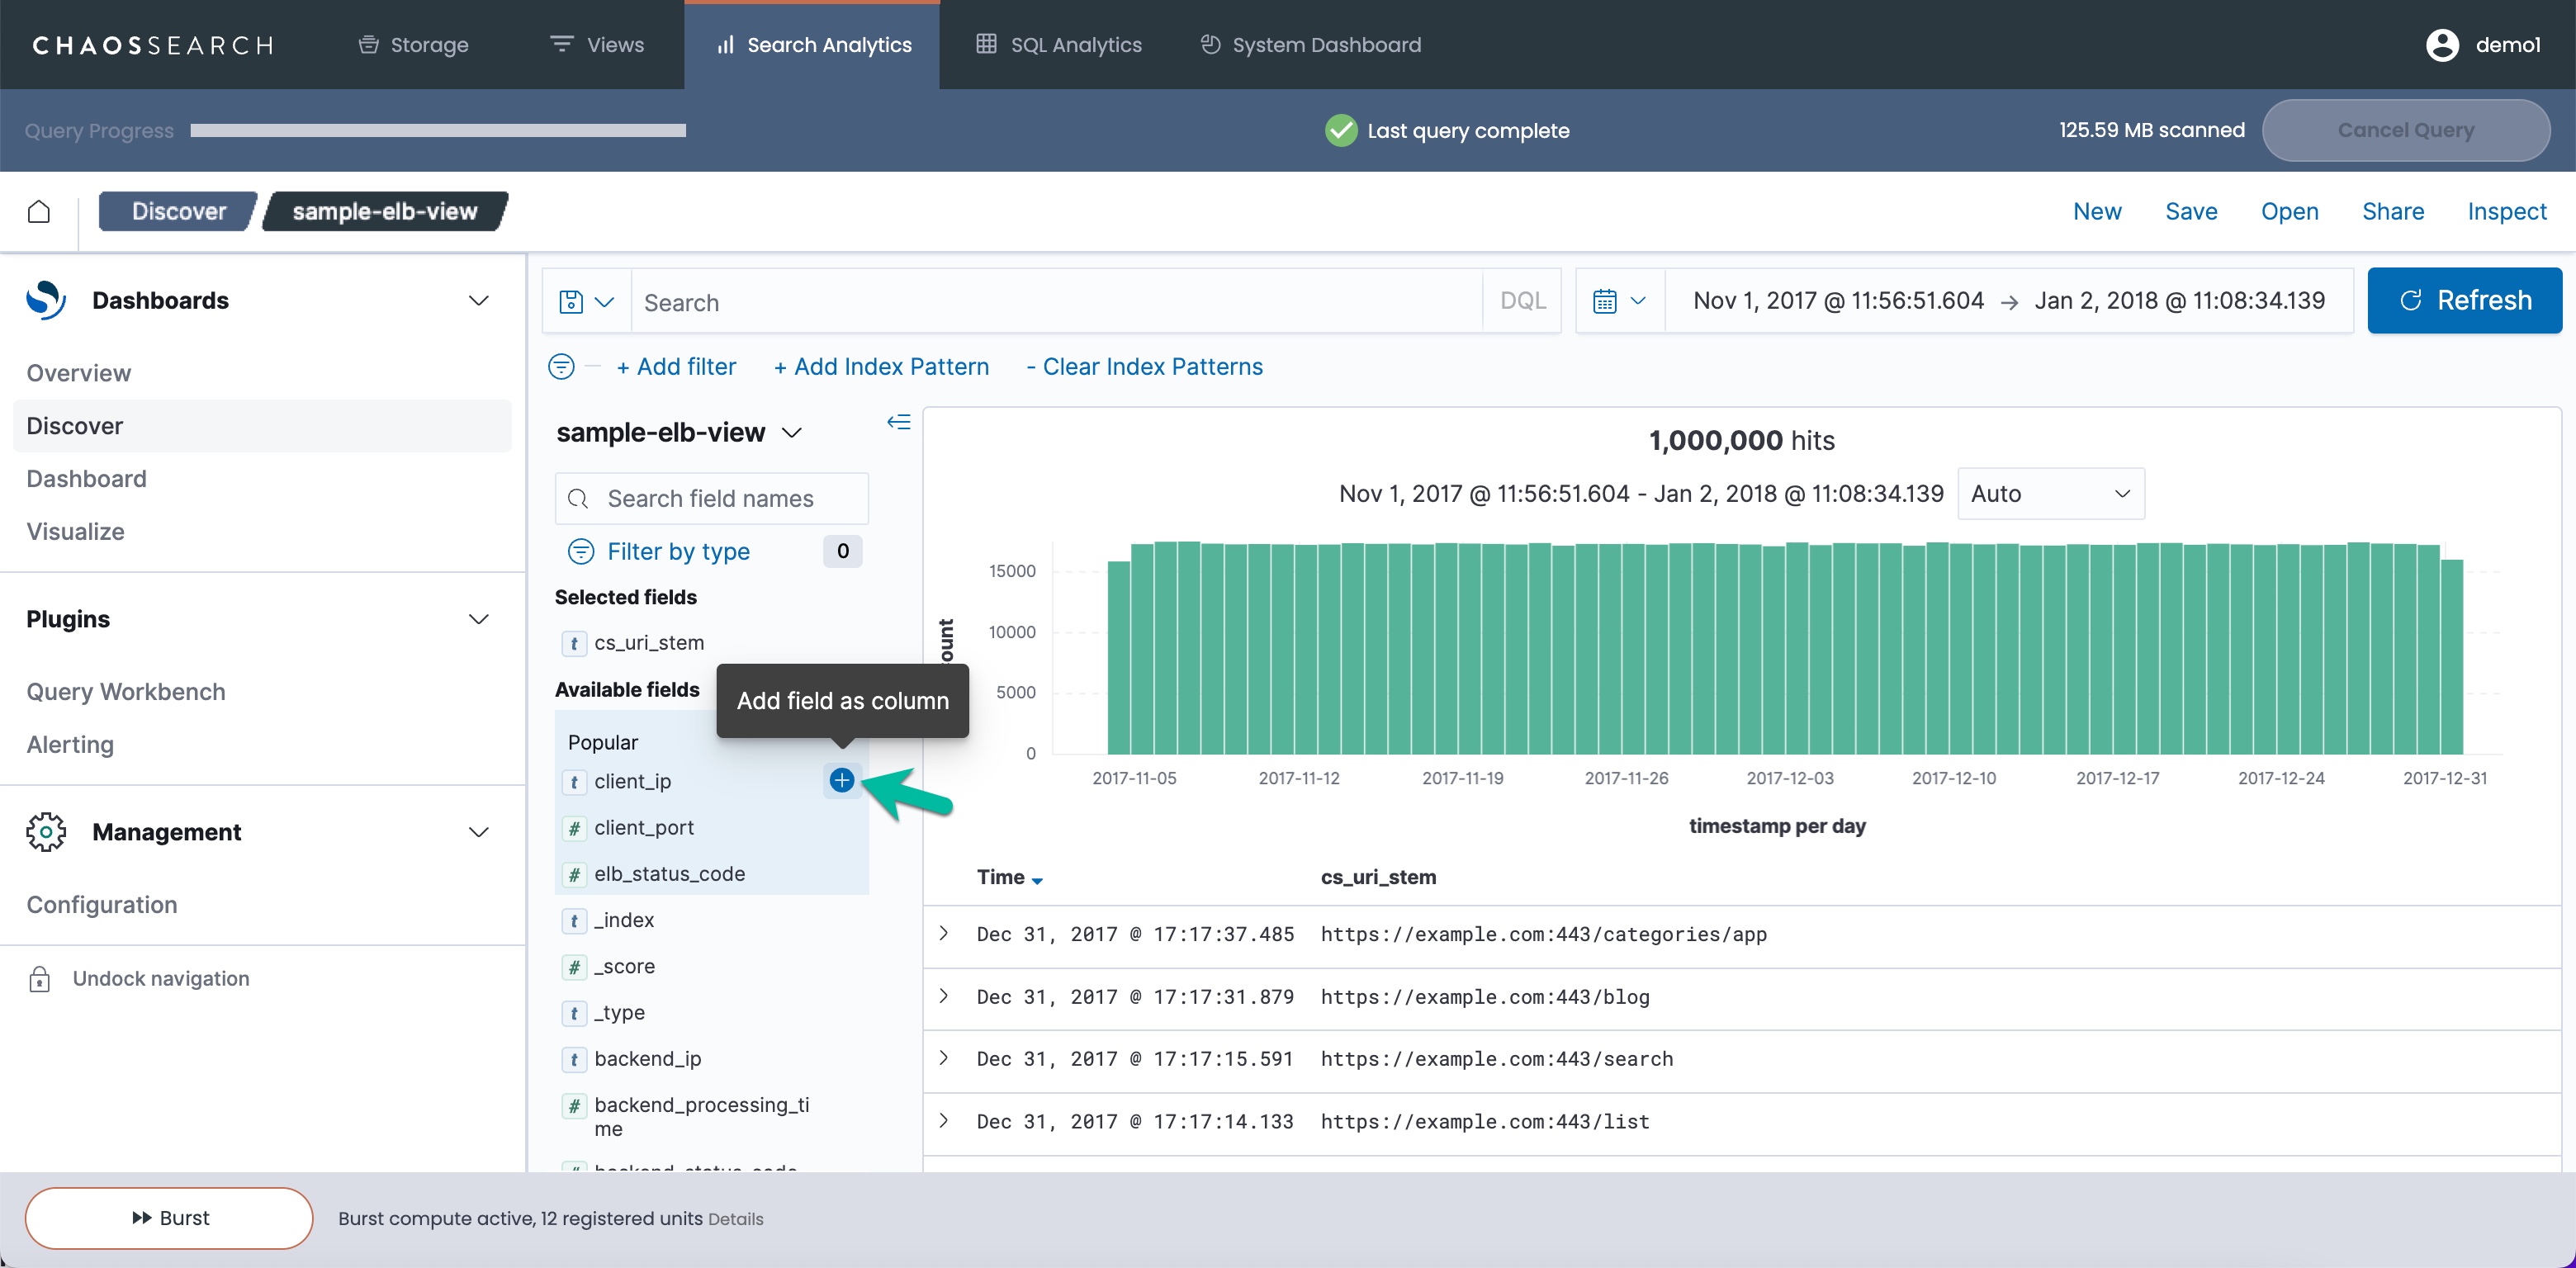
You can clear columns by hovering over each one in the Selected fields area and clicking the x to remove that option. If you remove all of the Selected fields columns, the record display returns to its default form.
The columns that appear in the Available fields list are based on the columns in the displayed results below the histogram. (Discover caps the number of results it displays, with a default of 500 records.) If columns do not appear in the fields list, you can run Discover with a wider time range to see more columns, or use the Add filter or Search bar at the top to search for specific columns and values of interest across the time range.
Filtering and Displaying Top Results
If you select an Available fields column, Discover displays a pop-up of the top 5 values present in the results displayed below the histogram:
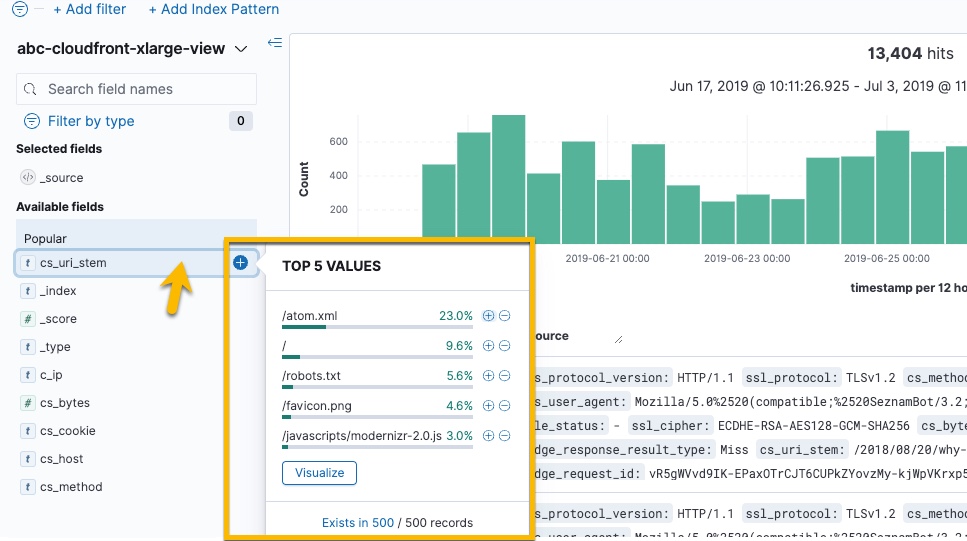
You can click the plus sign for a top value to add it as a filter and re-run Discover to search for new results specific to the selected column and value.
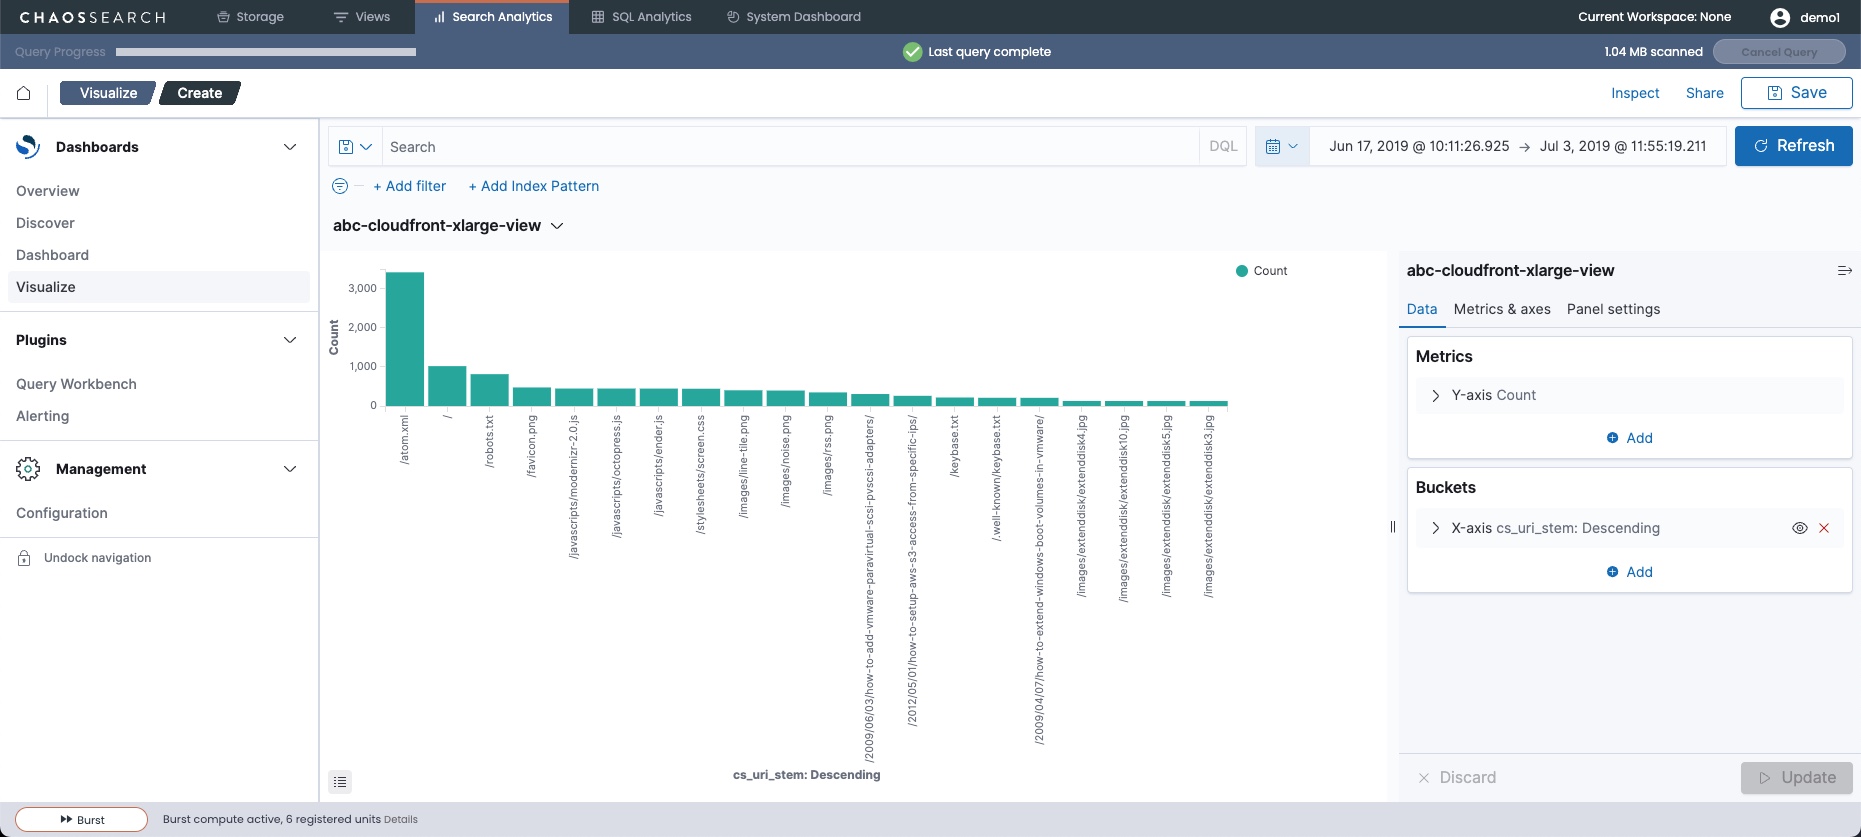
The top values are based on the results that appear below the histogram.To display the top results for a column across the entire dataset for the Discover search that you just ran, click Visualize in the Top 5 Values window. Search Analytics automatically drills-down to a vertical bar chart that shows the top 20 values for that column across the Discover time range. You can adjust the Visualization options to display more or less results as desired.
Updated about 1 year ago