Using Pre-Built Visualizations with Views
Review the following topics for an overview of the pre-built OpenSearch Dashboards visualizations
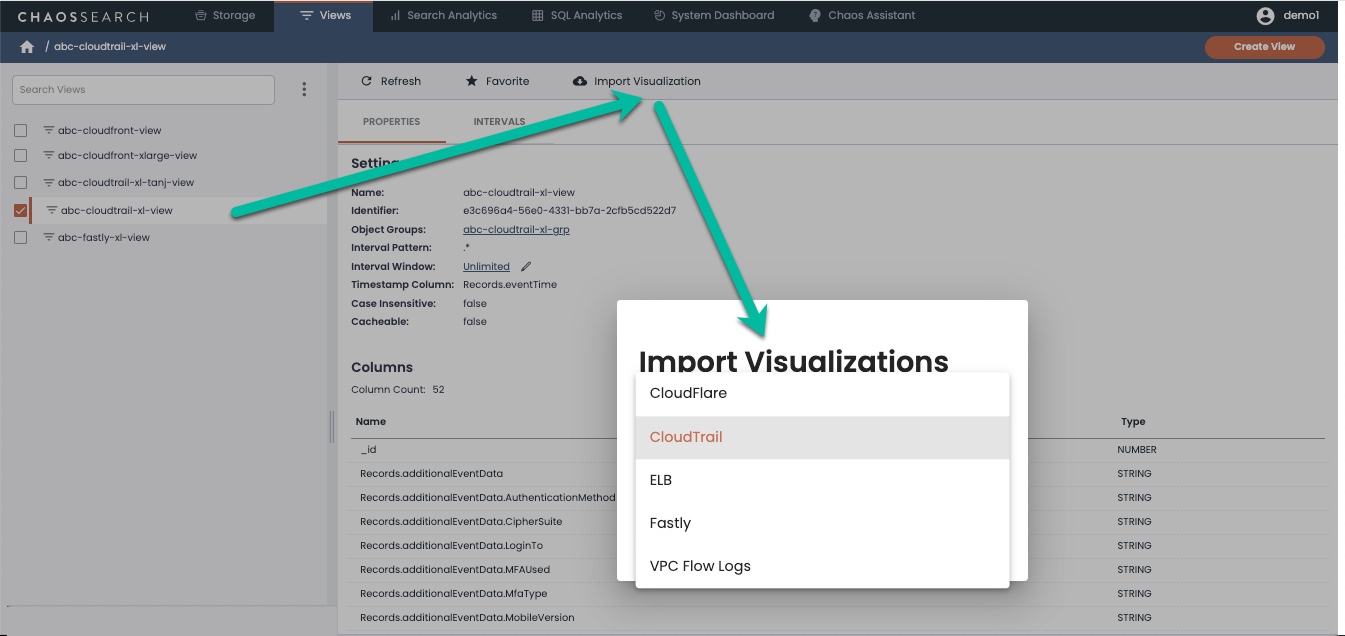
ChaosSearch includes some pre-built visualizations that you can use with your views for AWS CloudTrail, Cloudflare, ELB, Fastly, or VPC Flow Logs. The sample sets are available as options from the Views page Import Visualization menu.
There are also some separate custom JSON visualization templates in later topics for Fastly, Slack, and NGINX to offer a starting point for users of those applications/services. You can import the NDJSON files for these applications using the Search Analytics > Configuration page; the system will prompt you for the correct view name to use in your environment.
The pre-built visualizations are designed to work with each application/service type, but keep in mind that edits might be needed if the templates refer to columns that are not found in your associated view. A pre-built visualization might not be useful for your data. You can test them to see if they are helpful or if they might be good starting templates for similar visualizations for your data.
Sample dashboard NDJSON files are available.The following topics show some example dashboards that were created manually to highlight the pre-built visualizations. Contact your ChaosSearch Customer Success representative if you would like to obtain a copy of the NDJSON files for the dashboards.
Updated about 1 year ago