Step 3. Define Views
Use Refinery views to filter and access indexed data for search and visualization.
After you create and index at least one object group, use the ChaosSearch Refinery® to create views. Views are a lens into the indexed data for one or more object groups. You can define how to transform, explore, and query that data for tools like the Search Analytics/OpenSearch or interfaces, SQL/ML analysis tools, and supported integrations.
Refinery views have powerful features to virtually transform the indexed data fields, and to materialize the content of fields into columns for end-user visualizations and analytics. You can also filter the data intervals to include to limit analysis to a specific time range, and set various behaviors such as caching results or case-sensitivity for querying. For more details about creating views, see Views.
The steps to create a view:
- Select one or more object groups with indexed data that you want to analyze.
- Select the data intervals and/or filtering or transformation options.
- Specify a user-recognizable view name and processing options, then save the view.
After the view is created, the view name can be referenced using querying and analysis tools. Views can be created using the ChaosSearch console, APIs, or Terraform Provider. The following steps show the console workflow.
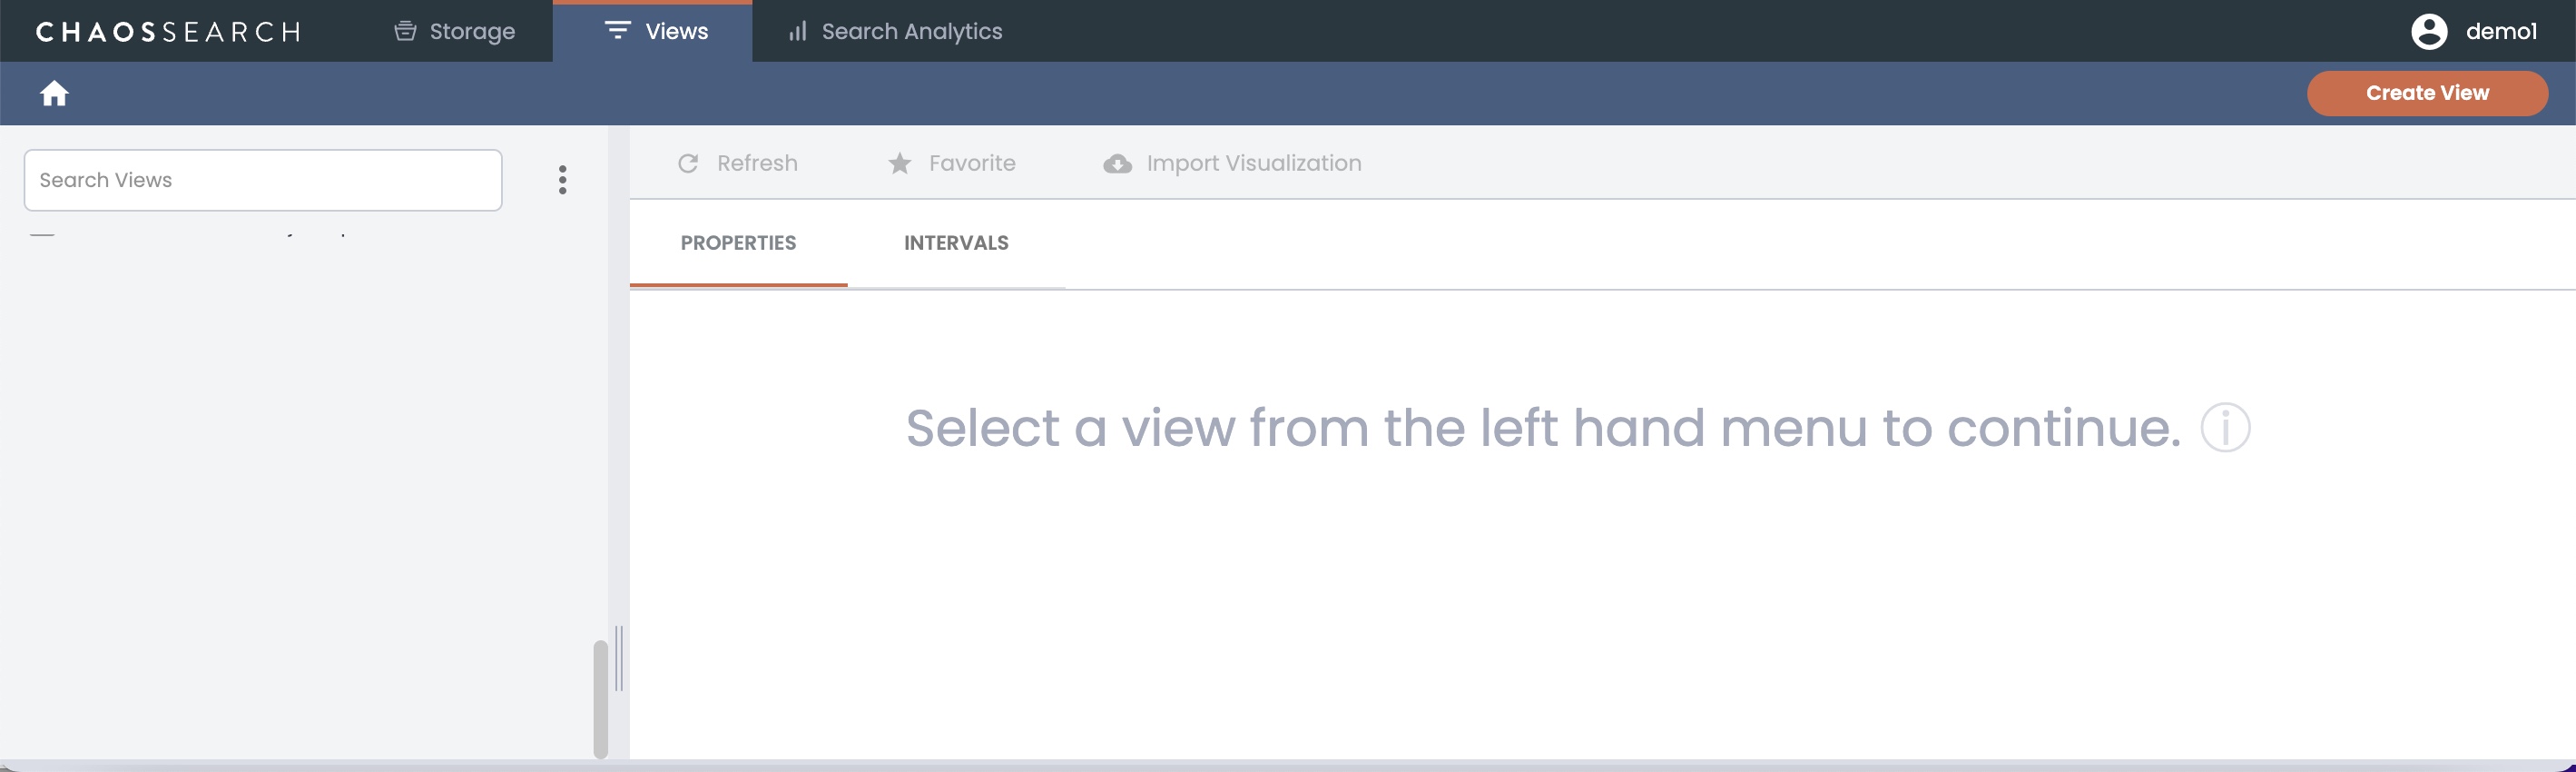
To create a view, navigate to the Views tab and click Create View.
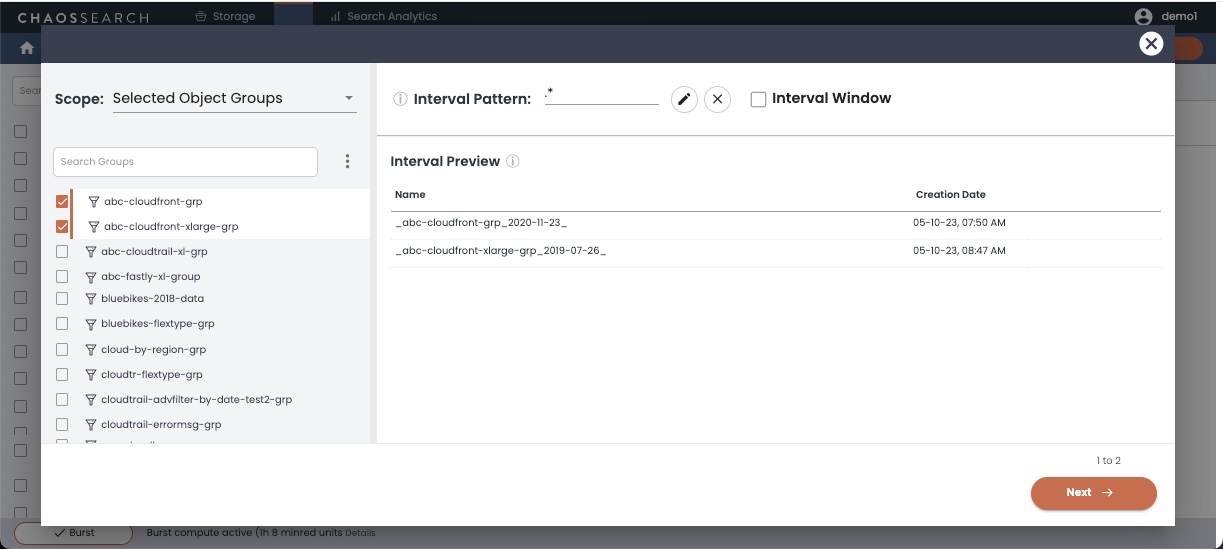
Select Object Groups
Select one or more object groups to associate their indexed data with the view. The pane updates to show the list of daily intervals for the selected groups. You can restrict analysis to daily interval file names that match a pattern, or to those with a filename date within a time window like last 3 days, then click Next.
Filter and Transform Data
In the Schema Transformation window, review the data model/schema for the columns in the view. You can define filtering rules on one or more columns, and you can apply a powerful set of predefined, schema transformation types to virtually transform fields within the context of the view (that is, without changing the indexed data stored on disk) by clicking the gear icon.
Other views that include the same data intervals can treat the data uniquely within those lenses. For example, users can create a materialized column with a regular expression on an existing field, or with a JSONPath expression on a JSON string field. A column named client_ip can be materialized from string to IP type to be used for IP range filters. Virtual transformations place the power of the data typing in the hands of the end user analysts, allowing them to easily manage and render the data to support their tools and analysis, all without the costly re-pipelining or duplicate indexed data impacts of other solutions.
Create the View
After you specify any optional filtering or transforms, click Next to proceed to the view naming and final steps. You can specify controls like query caching and case insensitive querying as applicable.
After you create the views that provide the analysis window to your indexed data, you can start to query, search, and visualize your data using your analysis tools or APIs.
Updated about 1 year ago
What’s Next
Run queries, create dashboards, and gain insight from your log files and data.