Editing a Dashboard
How to edit SQL Analytics dashboards
You can edit a SQL Analytics dashboard to change its chart components, look and feel, or to add or removed tabbed sheets.
To edit a SQL Analytics dashboard:
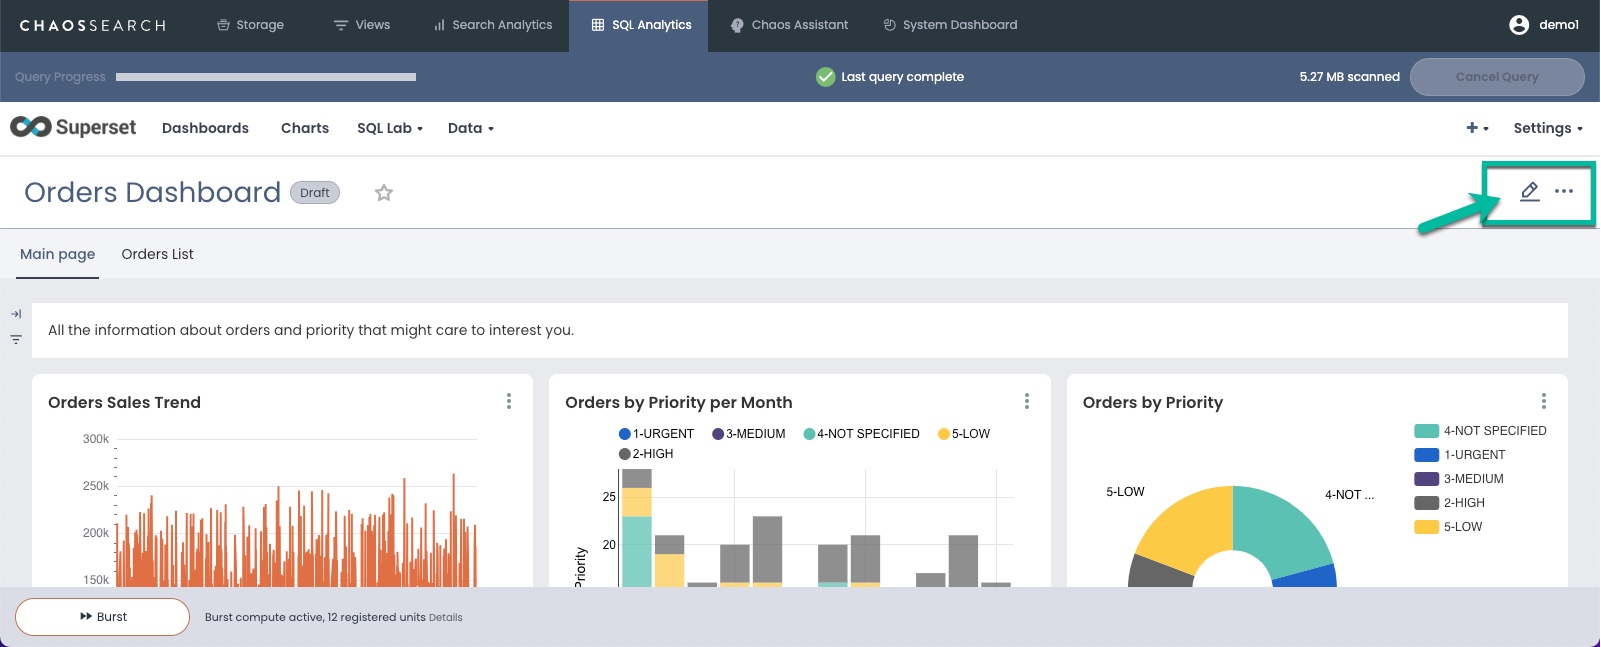
- Display the dashboard that you want to edit.
- In the top right corner, click the Edit Dashboard pen icon.
- The edit display opens a Components panel on the right and controls for the tabs on the left.
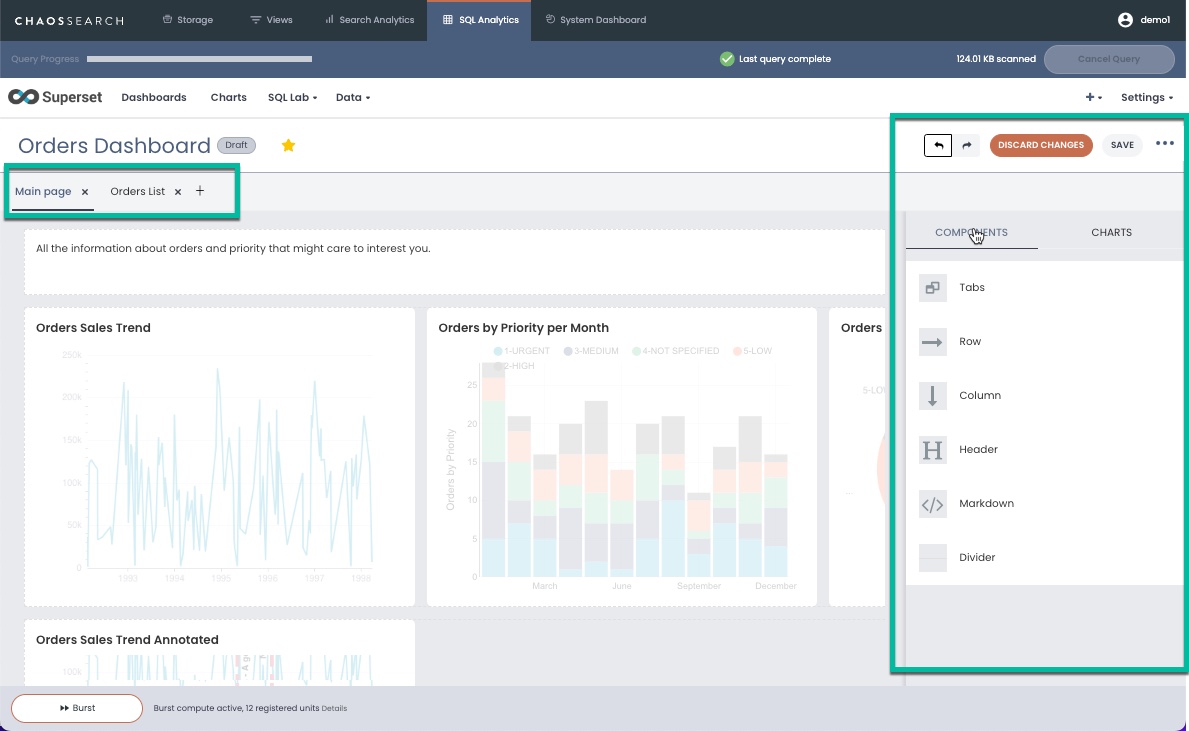
- You can use the Components panel options to modify the display for the charts, manage tabs, and add headers or other display design elements.
- On the left tab menu, you can add new tab pages to the dashboard or remove an existing tab as desired.
- In the right panel, click Charts if you want to add more charts to the dashboard. The Charts panel shows any already added charts in a grayscale color, the darker text highlights the charts that are not part of the current dashboard.
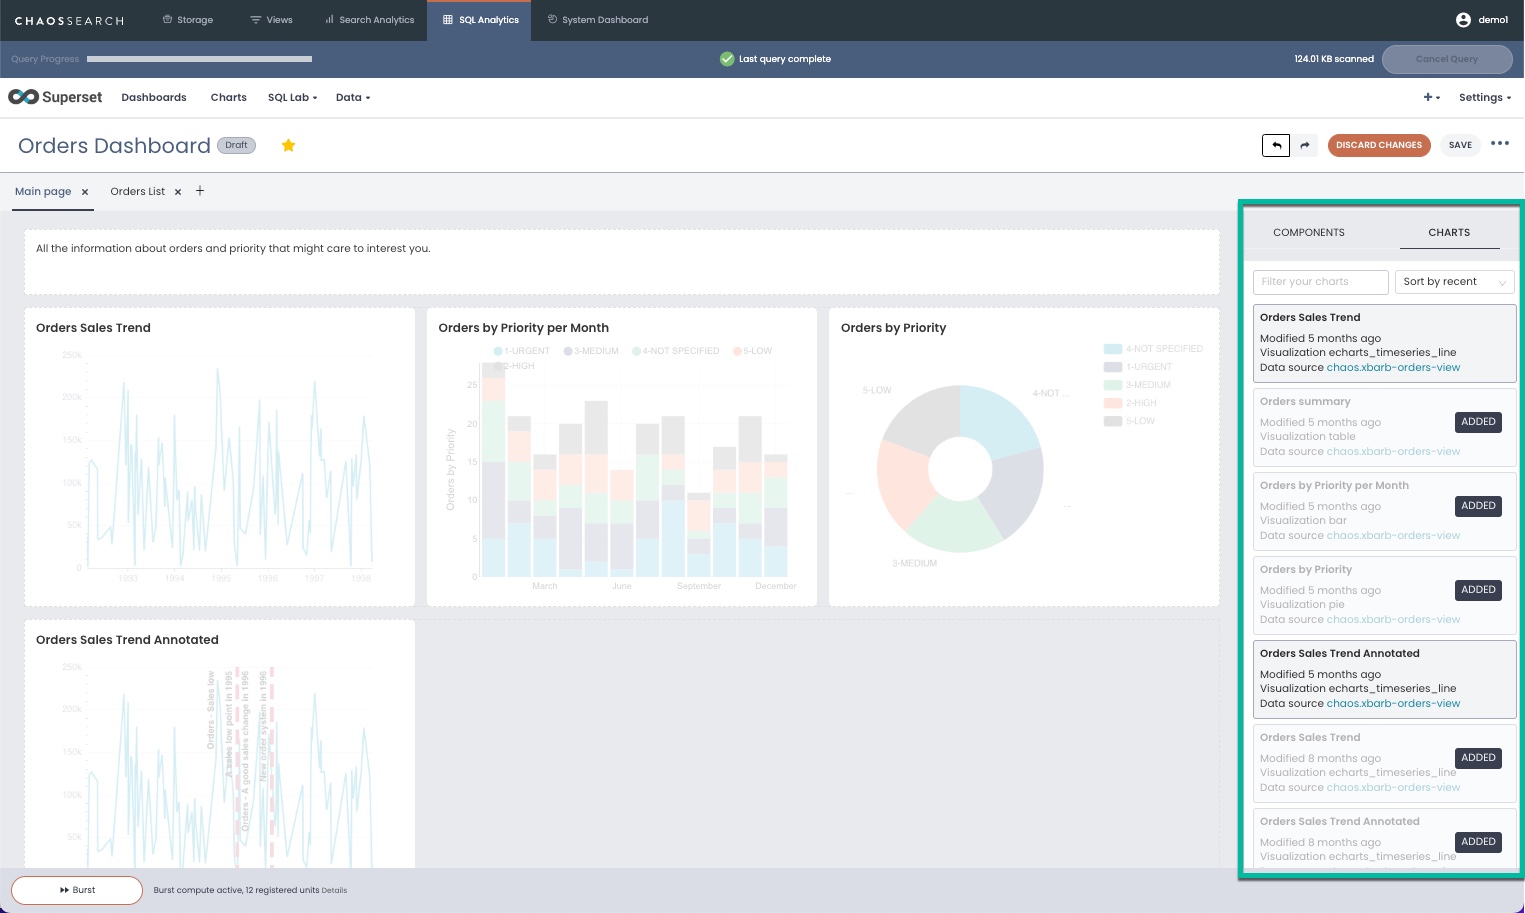
- Drag the box for the chart that you want to add into the dashboard.
- When your edits are complete, click Save in the top right.
Updated about 1 year ago
Did this page help you?