New Features and Updates in the UI
A summary of the changes, improvements, and terminology updates in the ChaosSearch UI
This topic provides an overview of improvements and changes within the user interface, with some links to updated topics and more information, and a summary of the terminology updates.
Improved Tab Organization and Flow
The main tabs of the ChaosSearch interface are renamed and reorganized to streamline the workflow for configuration. For administrative users, the default tabs include:

- Storage – List the cloud-storage buckets configured for the system, and manage the object groups created in each bucket. You start object group creation in this tab, and manage indexing from this tab. Within the tab some areas have been renamed and updated for clarity. See Storage Tab and Object Group Updates.
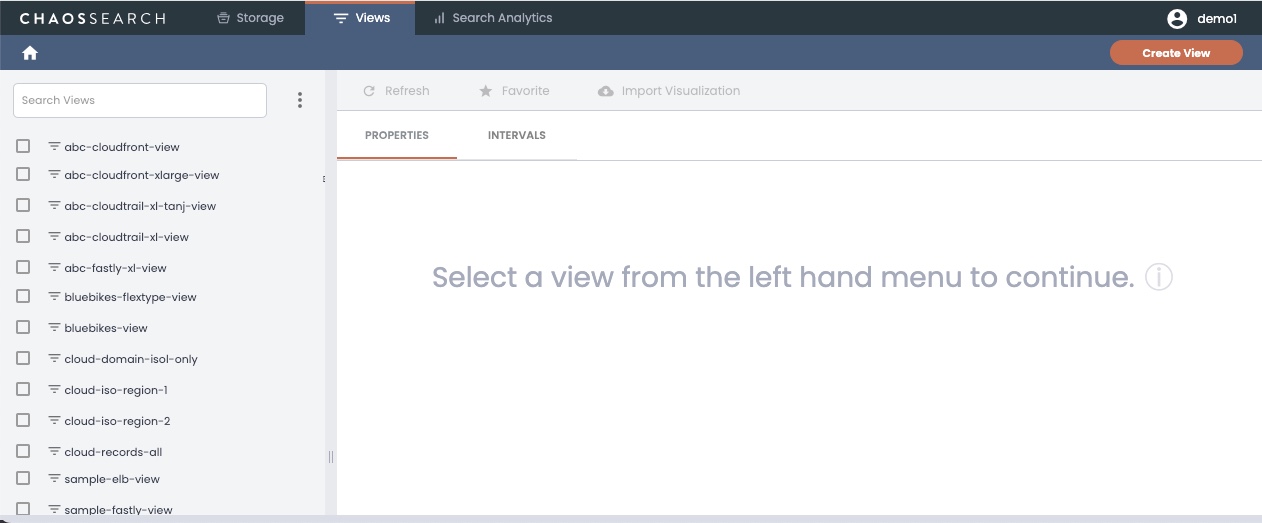
- Views – Formerly the Refinery tab, use Views to create and manage the lenses to your indexed data.
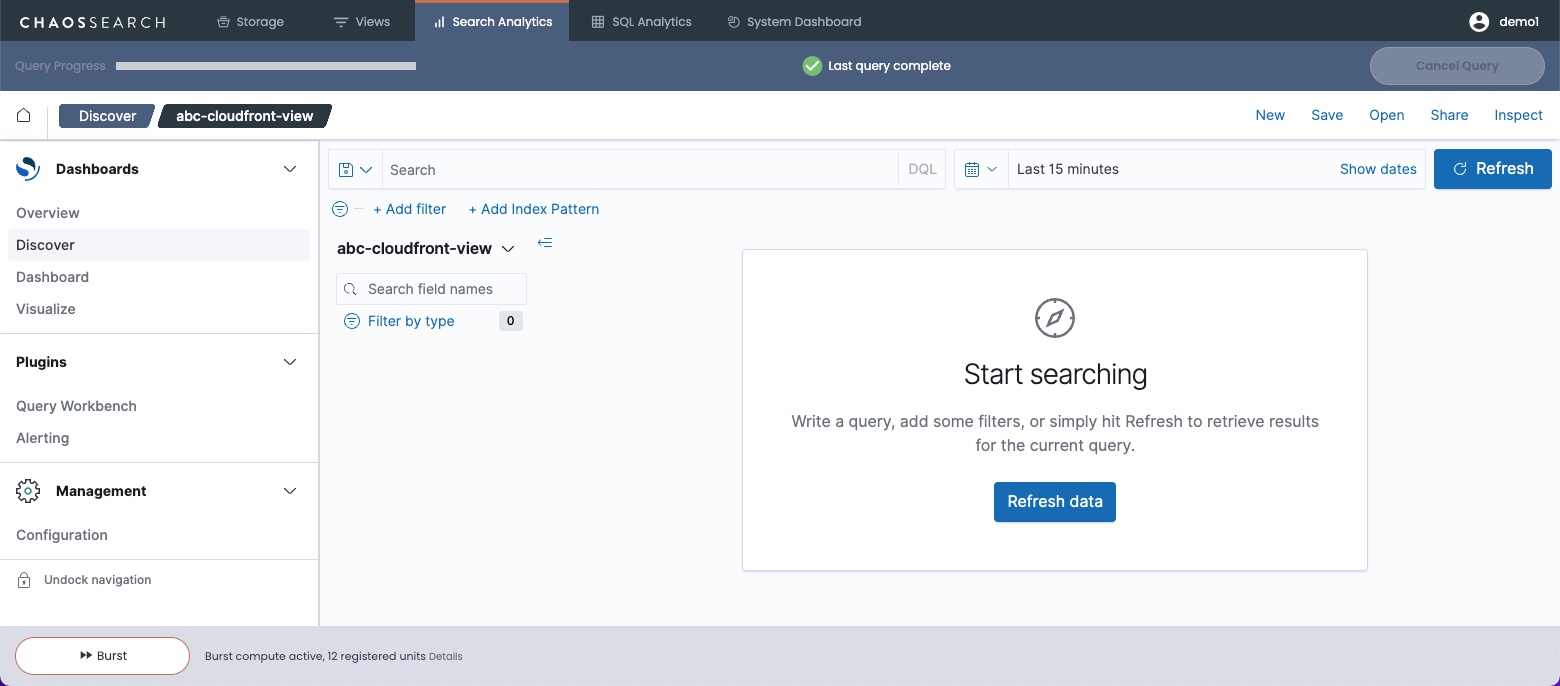
- Search Analytics – Formerly the Analytics tab, this is the access to the embedded OpenSearch Dashboards search and visualization portal.
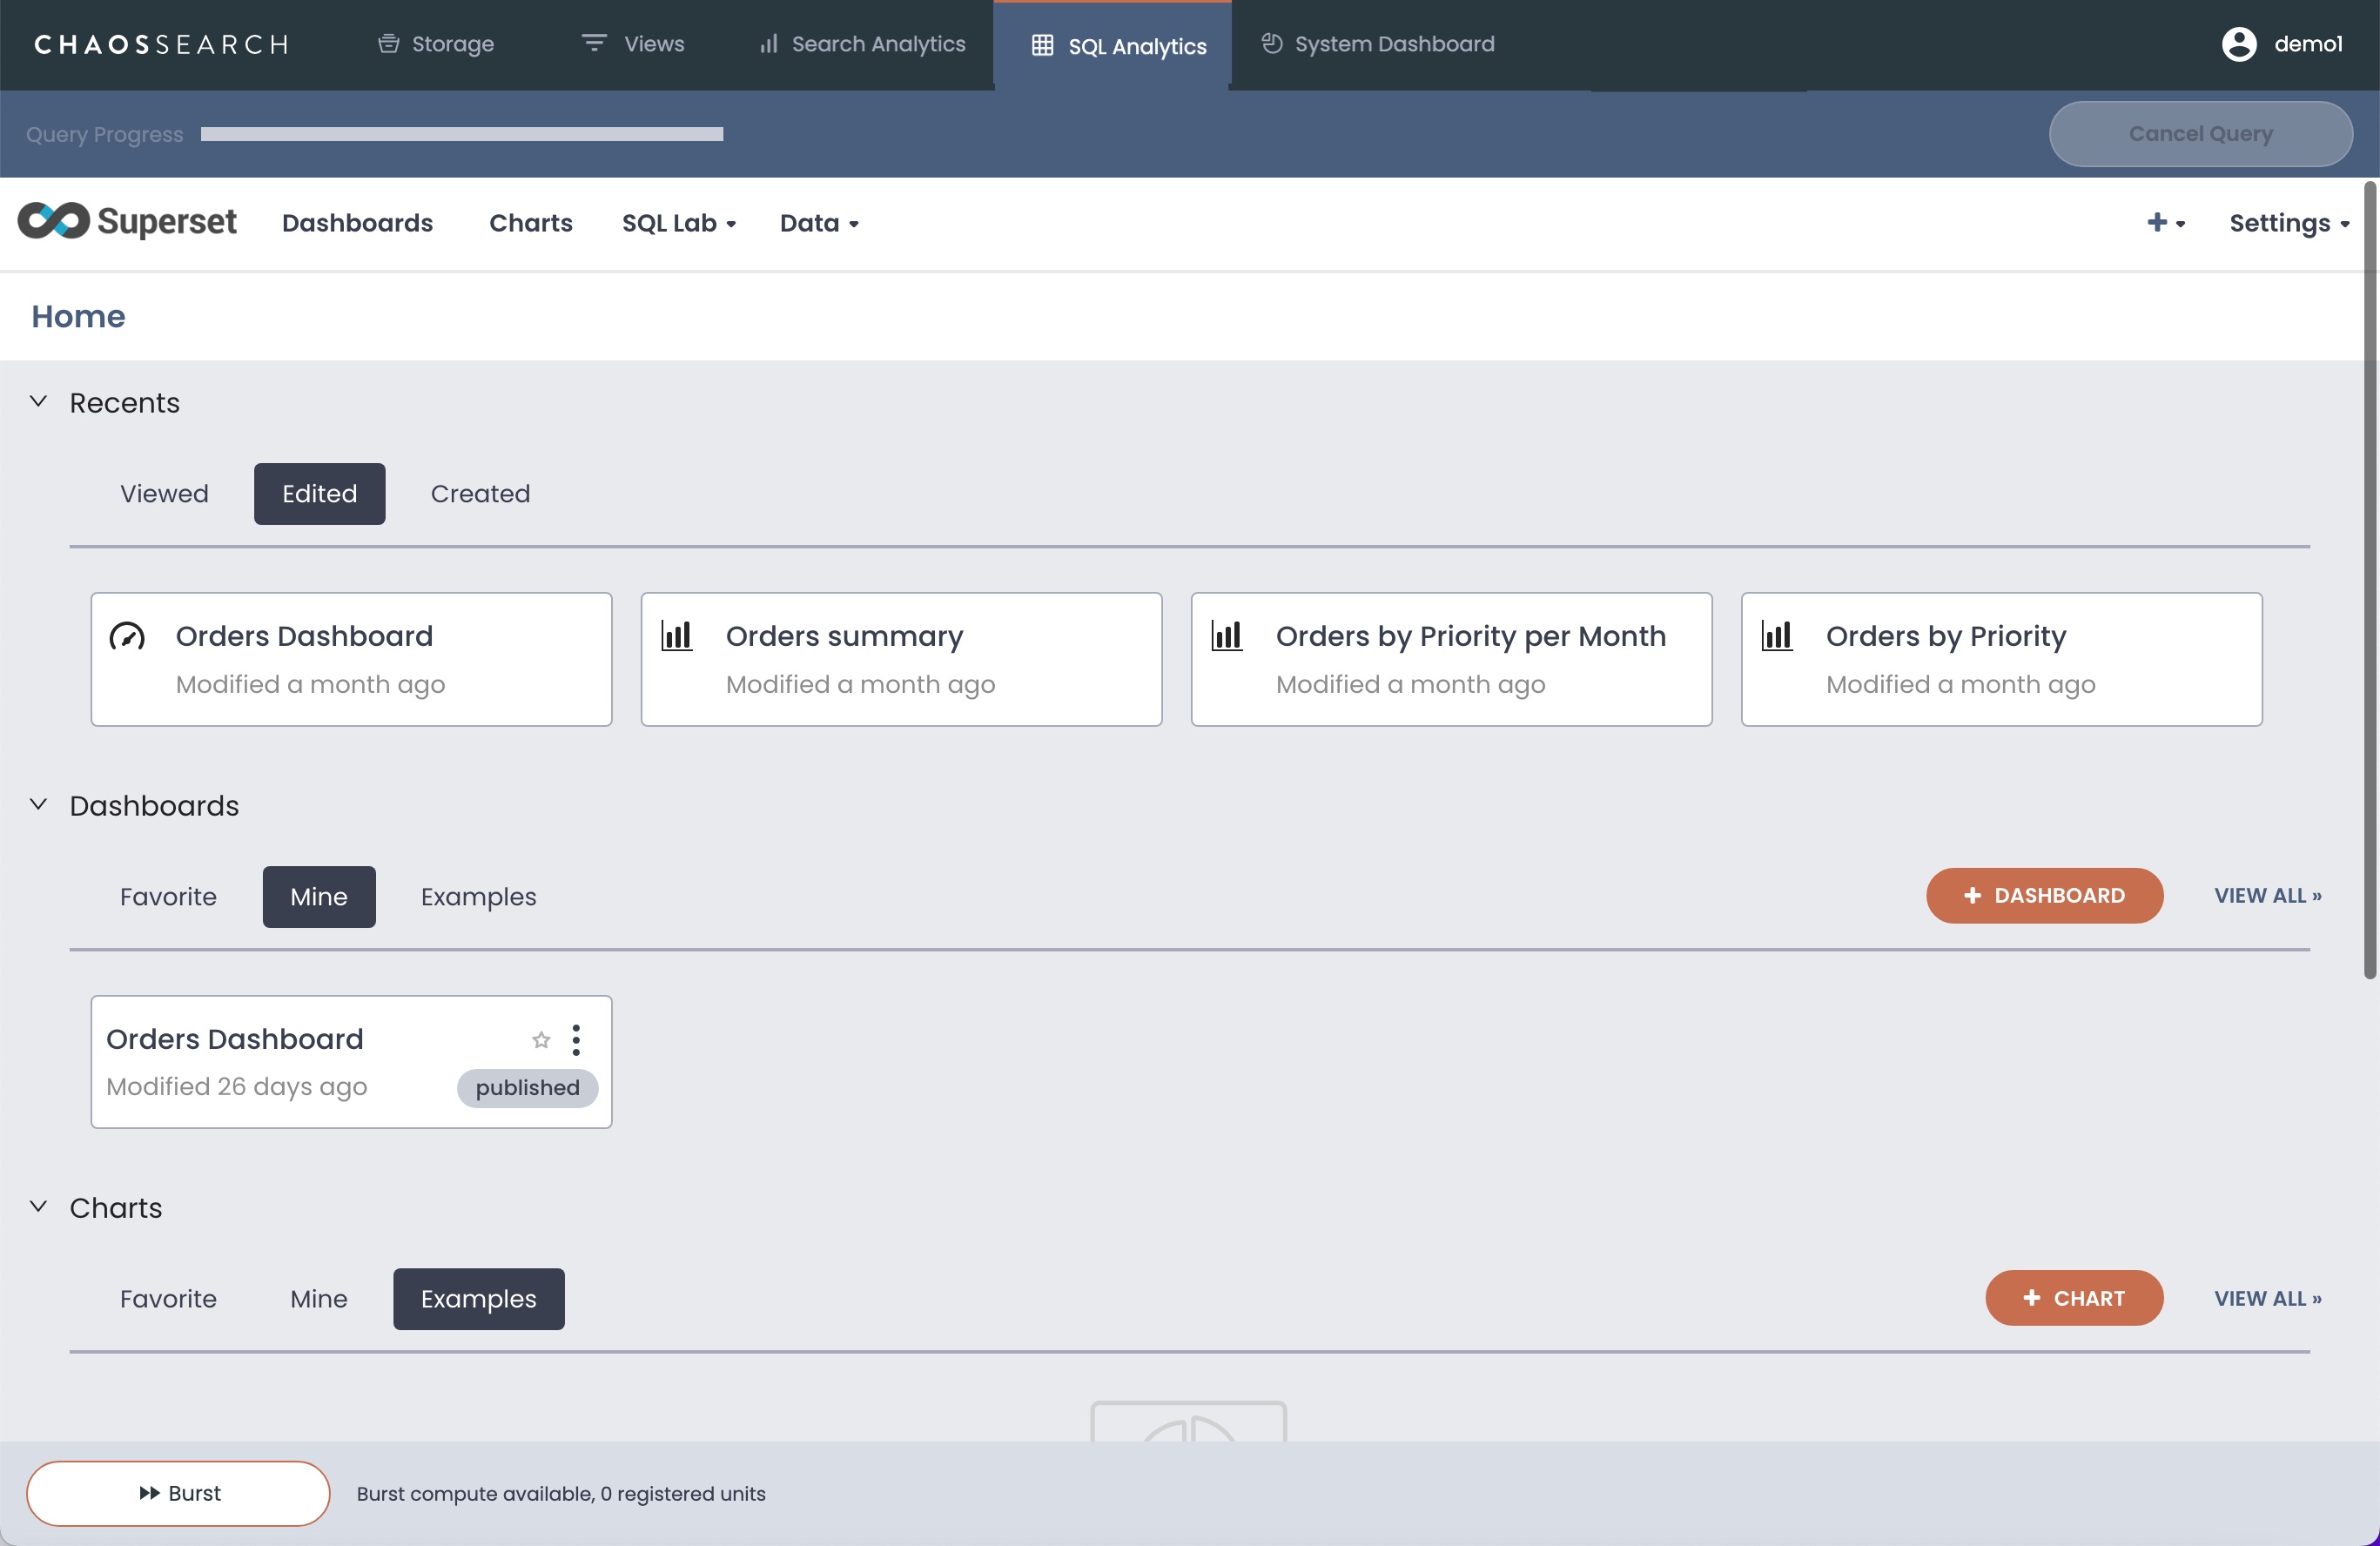
- SQL Analytics – An optional feature/tab that provides access to the embedded Apache Superset SQL query and visualization portal.
- System Dashboard – The same tab to access the system management and operations status portal.
- Chaos Assistant – The optional Early Access feature/tab of the natural-language, chat style, AI-driven interface to your ChaosSearch indexed data.
- Settings – Click the user icon in the top right corner to display the Settings menu and permitted areas such as account management, bulk query export, help/documentation, or to log out of the console.
The tabs that appear for each user/subaccount are controlled by the RBAC settings in the groups that are assigned to each user.
Storage Tab and Object Group Updates
Within the Storage tab and its subpages, note the following changes and updates:
- When you select a cloud-storage bucket, the Storage page allows you to browse the Objects contained in the bucket and any Events for the bucket. The Objects pane area replaces the former File View and Bucket Content panes in one display.
- When you select an object group, the Storage page shows panes for Objects (formerly File View) , Properties (formerly Group Content), Events, Intervals (formerly Indexes), and Isolation (formerly Partitions).
Terminology Update:In the latest console, the term field represents a field in the indexed data schema for the object group. In the past, field and column were used as synonyms in the UI. The term field now refers to a uniquely named information component in the indexed data of an object group, which then becomes a column in the Refinery view schema.
Other term and tab changes within the Storage and Object Groups area:
- Target Workers (formerly Target Active Index) -- A setting used by ChaosSearch to override, when needed, the number of workers allocated for indexing for the group.
- Isolation Key and Isolation (formerly Partition Key and Partitions) -- A feature to separate the indexed data for a group based on keys derived from object pathname regular expressions.
- Intervals (formerly Indexes) -- The daily indexed data files created for the object group.
Create Object Group Changes
The Create Object Group workflow has been updated with naming changes to be consistent with the with the terms like intervals, partitions, and fields. So, for example:
- The Advanced Filtering button has replaced Object Filter, and now opens the Advanced Object Filtering window.
- The data separation controls are now Isolate By and you define isolation keys.
- The Schema Overrides button has replaced the Field Overrides button and window label. In the Schema Overrides window, the area where you upload the rules has changed from Field Selection to Schema Policy.
- References to "column" in the object group configuration have changed to field.
- Note that the Create and Start button has been removed from the Create Object Group window. It is best to create the object group, and then to review the group definition and start indexing after confirmation.

- Object groups now ingest PARQUET format data sources, just like CSV, LOG, and JSON formats, and now support snappy-java framing for ingest/indexing with a new SNAPPY-JAVA compression option available during object group creation. See Creating Object Groups.
Static Object Group Changes
New static object groups use an improved discover process to find the cloud-storage files to index. With this change, the discover process applies a stricter set of rules for the object group's regex filter to locate the matching cloud-storage objects to index. As a result, static indexing is faster and the index content more aligned with the group's regular expression definition.

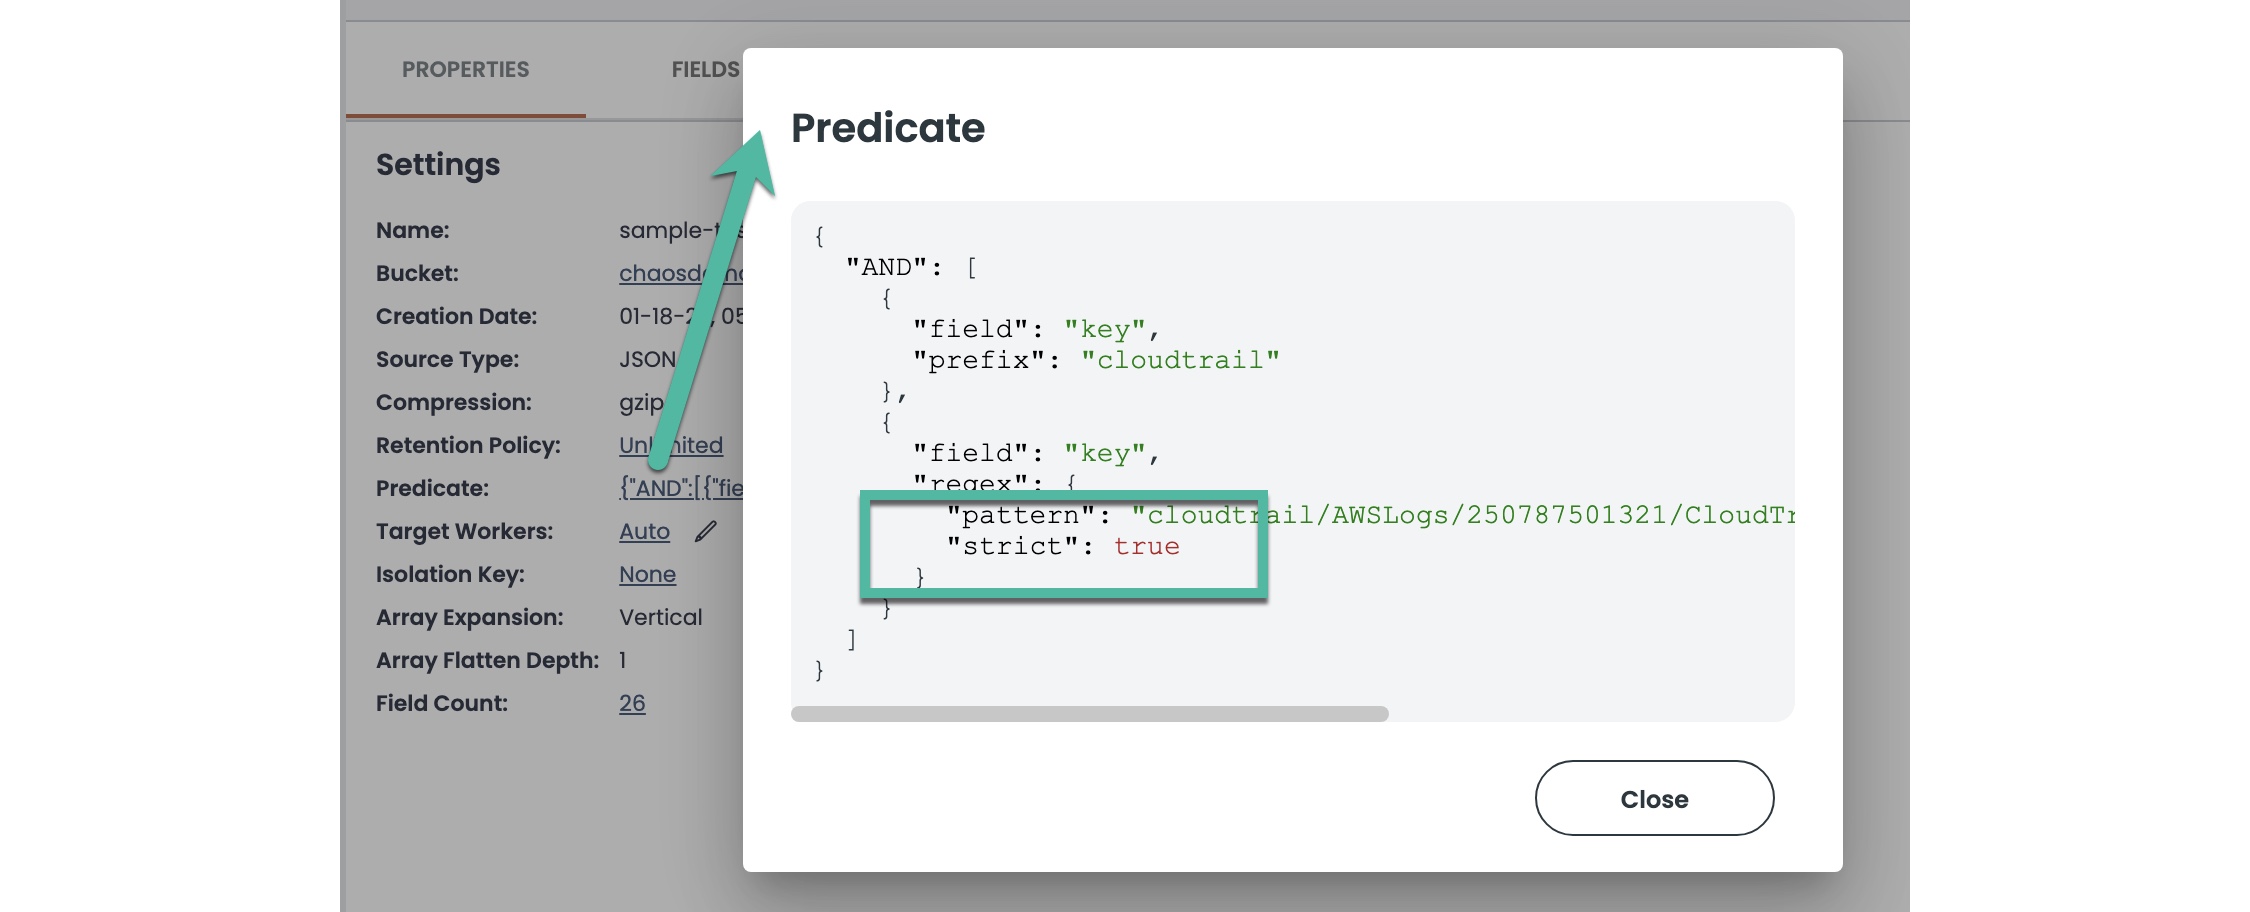
The match rules take effect when new static object groups are created; previously created static object groups continue to use the former, wider matching rules that were in place when those groups were created. To determine whether a static object group uses the new matching rules, click the Predicate field link for the group, and look for the "strict": true setting for the regex definition. Note that this setting will appear in new Live Index object groups as well for a consistent group structure, but the setting is meaningful only for static object groups.
Views Tab
The Views tab (formerly the Refinery tab) is renamed to improve the usability for finding and creating views in that area. The pages have some improved naming and tab flows, but the functions and general workflows are the same.

Within the Views page, there are some term and label changes for Intervals (instead of Indexes), the Properties tab (formerly View Summary), and now uses the term Columns to refer to the parts of the view schema (instead of Index Structure or Field).
Create View Changes
The Create View workflow is the same, but there are some naming and label updates for consistency with the new view terms, for example:
- References to the term "index" have changed to "interval", and "field" to "column."
- References to "partitions" and "partition keys" have changed to "isolation" and "isolation keys."
Search Analytics Tab
The Search Analytics tab (formerly Analytics) provides access to an embedded version of OpenSearch Dashboards, which is the visualization application from the OpenSearch Project. The foundation of OpenSearch Dashboards begins with the Kibana 7.10.2 open-source version, and many of the UIs and features are similar. The Search Analytics defaults to opens the Discover feature so that you can select a view and start searching for your key data insights.

The Discover feature includes the following changes:
- The ChaosSearch view (e.g., index pattern) name now appears in the breadcrumb trail at the top. If you use Add Index Pattern to add another view to the search query, the breadcrumb trail view name is appended with a +1 (or greater).
- The Share menu now includes a Bulk Export Share option to export more than the default limit of 500 results from a Discover search. Records are written as files to a configured cloud-storage/S3 bucket location. Exported file format options include JSON and CSV, in compressed or uncompressed format.
- After running a Discover search, the Available fields filters now automatically convert multiple Top 5 Values selections for the same field into an
is one offilter, instead of creating multiple AND filters for each value selected. See Selecting Two or More Top 5 Values. - The Edit Filter autocomplete field selections now integrate the Top 5 results from the last search.
Within the Visualize panels:
- Use the Add Index Pattern to add one or more additional views to include in the chart. Click Clear Index Patterns to return to the original defined view for the chart.
- Users can now switch the views used for a visualization to an alternative view that has a matching schema. Click the view name for the visualization to open a selection list, select the new view, and click Refresh to update the chart.
- The optional JQ Transform support option in Search Analytics Visualization options now supports JQ scripting against the output of the aggregations field in the Elasticsearch response. This option is a limited availability feature controlled by a deployment flag.
Within the Alerts panels:
- Action throttling is now available for triggers associated with monitors.
- Monitor scripts have improved support for mathematical operations, and conditional logic (multiple conditions/triggers).
- Updated UI controls improve the information displayed for alerts, search bar behavior, and pagination controls.
The Plugins > Query Workbench feature connects you to a SQL querying interface using the SQL Analytics tools such as the SQL Editor.
SQL Analytics Tab
The SQL Analytics tab is an optional portal in the ChaosSearch interface. It opens an embedded Apache Superset that you can use to run SQL queries against your Refinery views. You can create charts and dashboards for visual analysis with the indexed data. With SQL Analytics, users have an alternative to the OpenSearch Dashboards search capabilities, enabling support for SQL querying and business insights from the same views and Chaos Index data.

SQL Analytics OptionThe SQL Analytics tab is an option and present on systems where this feature is enabled for the user deployment. For more information about SQL querying, contact your ChaosSearch Customer Success representative.
Other UI and Workflow Changes
Settings Menu
Bulk Export is available as an optional feature, and is accessed from the Settings menu. The Bulk Query Export enables the export of more than the capped Discover search result limit (default of 500) to a cloud-storage/S3 bucket location. Exported file format options include JSON and CSV, in compressed or uncompressed format.
General Changes
- In several create dialog boxes, the Submit button has been replaced by Save for clarity and more consistent controls.
- The console navigation bars have been reduced in width to enhance the value areas of the screen real estate.
- Search fields for lists like Search Analytics dashboards, visualizations, saved objects, and others have been improved to filter to the object names that contain the filter string, rather than only the object names that begin with the filter string.
Updated 12 months ago
