Building a Dashboard
Build and display powerful at-a-glance summaries for routine review or mission-critical task boards.
Dashboards are a way to combine multiple visualizations on one page so that users can compare important factors for the data in the indexes. Dashboards can have multiple panels, each with a visualization that offers insight to the data.
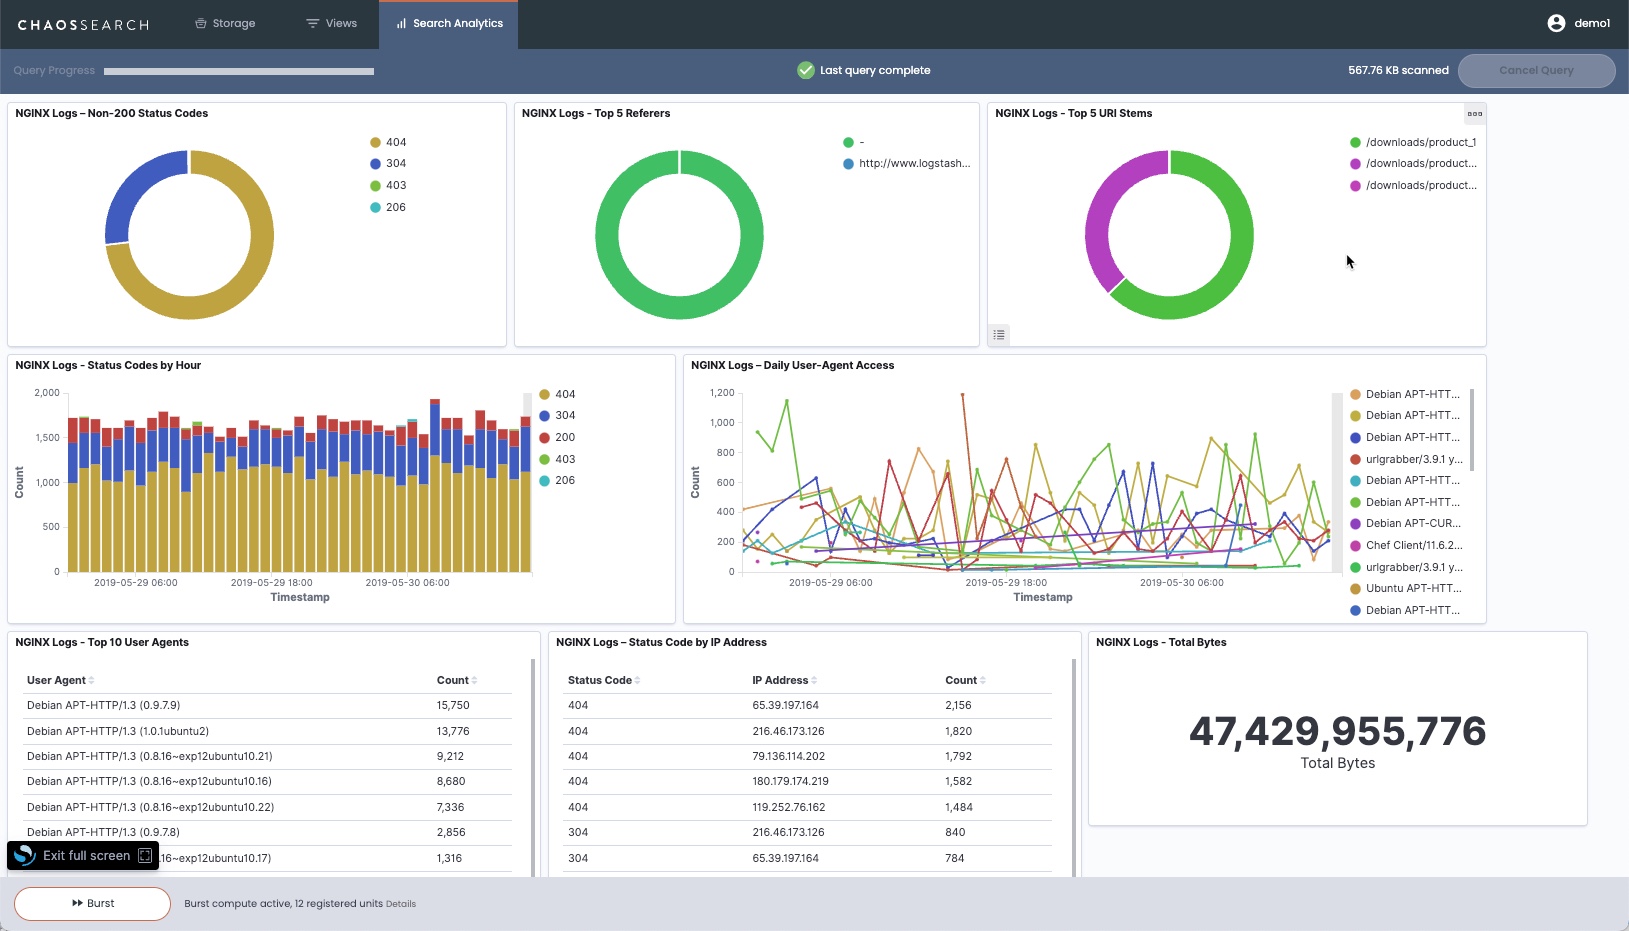
Dashboard creators can drag-and-drop favorite visualizations into a new dashboard, create new visualizations as desired, and arrange the panels on the page to create an information board for easy comparison and review for investigation or assessment of changes.
Multiple visualizations on one page create a powerful at-a-glance summary for leadership review of latest behaviors, trends, and volume, for example. They could also act as a periodically updated (refreshed) mission-control summary where panels and behaviors can be reviewed throughout the day to look for important changes or possible new problems that need investigation by technical staff. Like visualizations, dashboards can be saved, exported, and imported to ease access for users. ChaosSearch RBAC permissions can be used to grant or restrict access to the visualizations and dashboards.
Display a Dashboard
To display a saved dashboard:
- In the ChaosSearch console, click Search Analytics.
- In the left menu, click Dashboard. The Dashboards window opens.
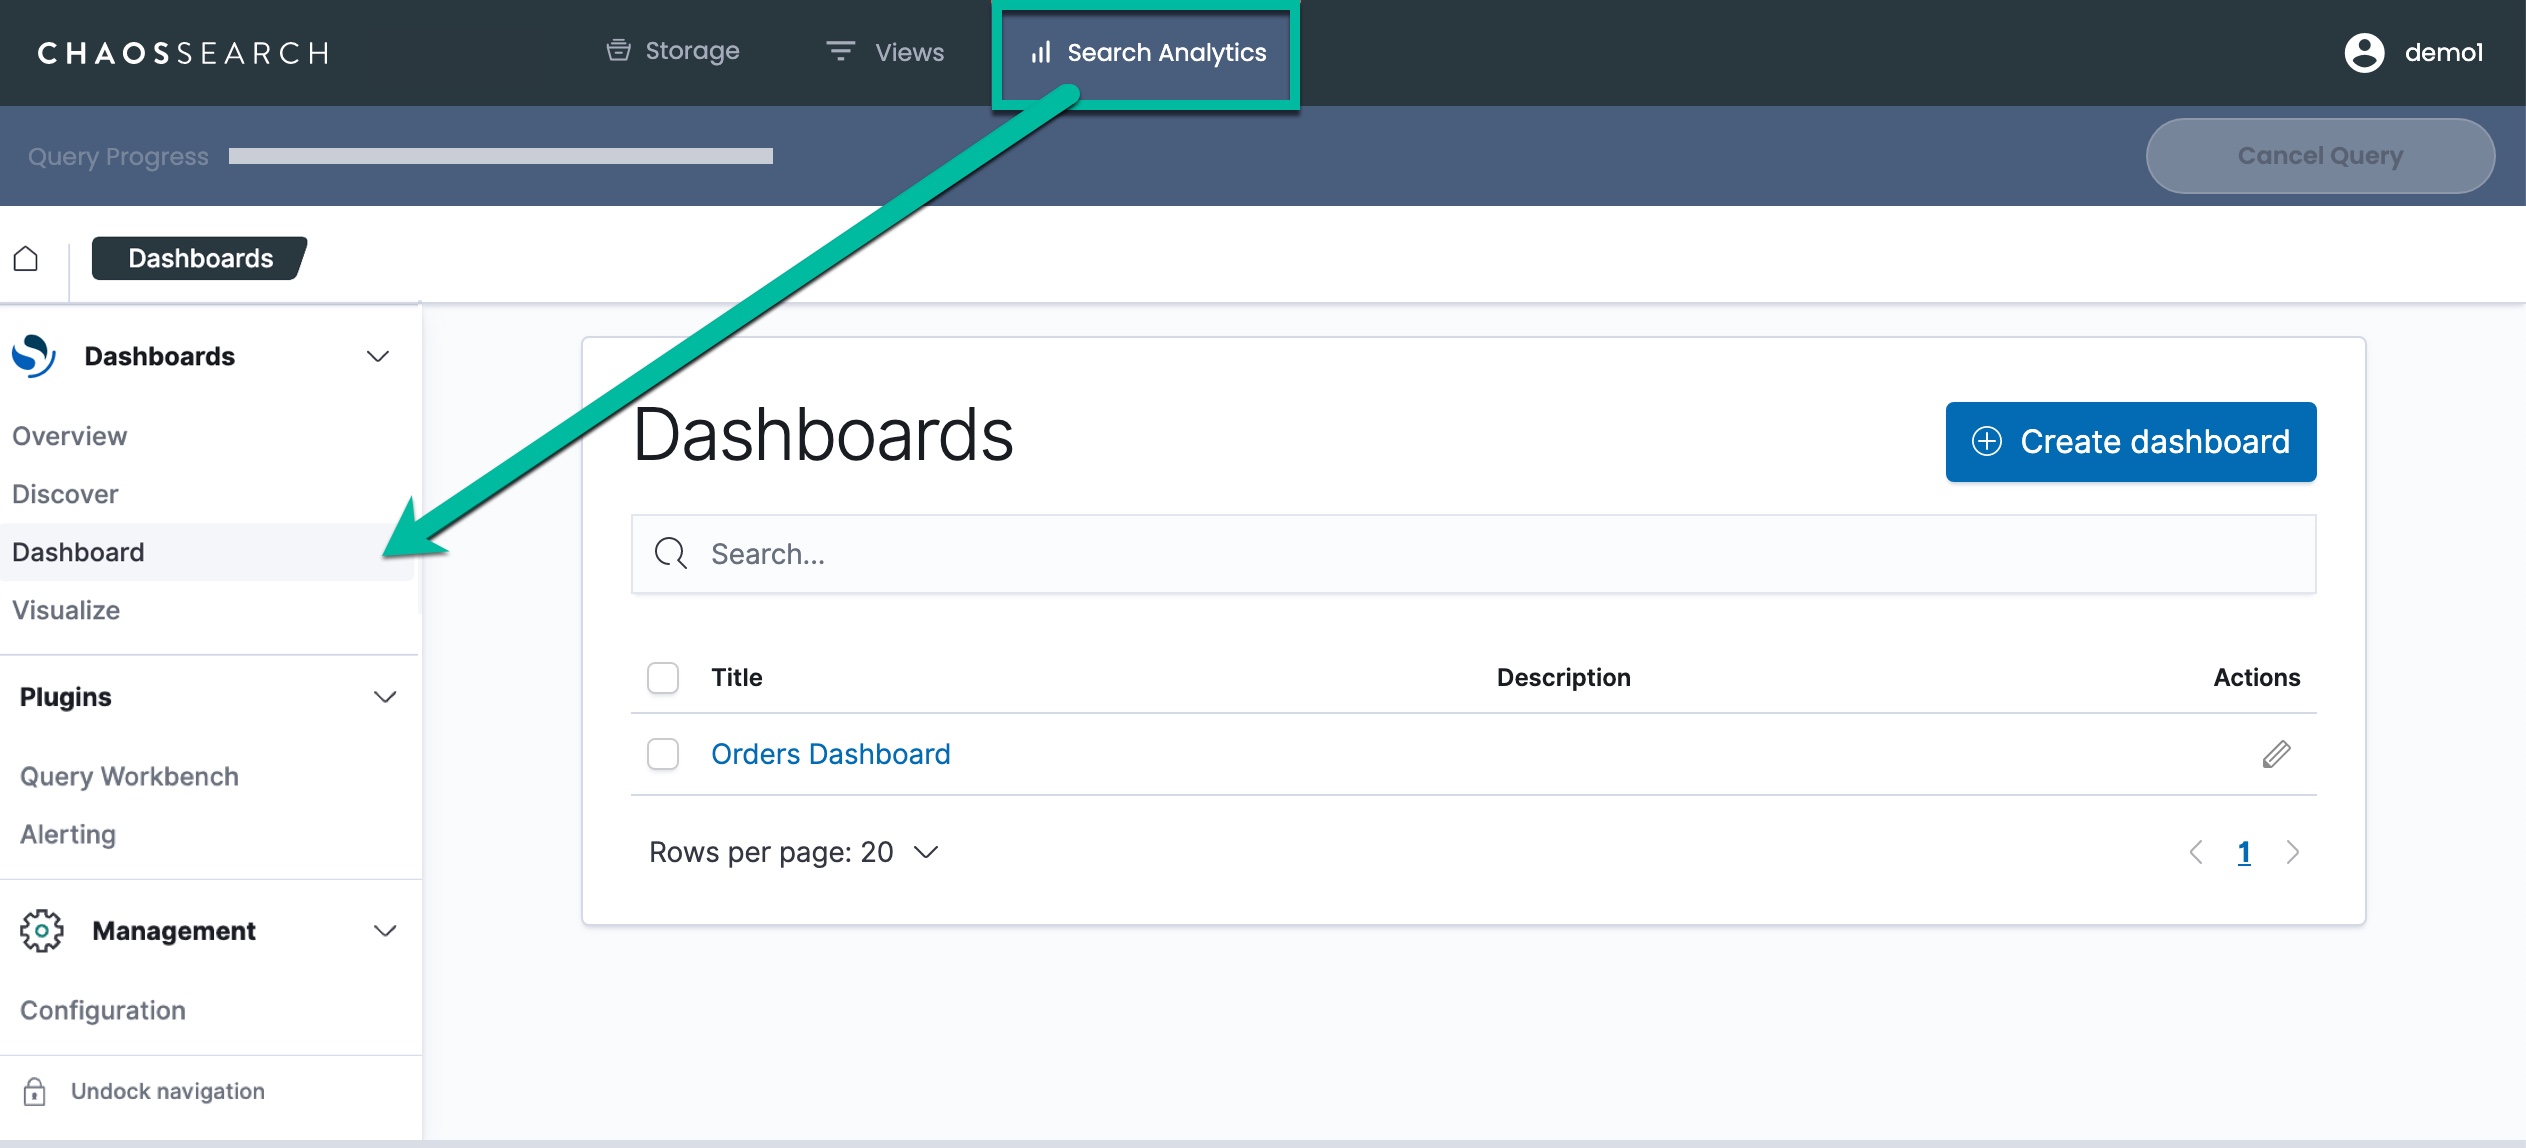
- In the list on the right, click a title link to open and display the dashboard. It could take a minute for the dashboard to run the queries to populate the charts.
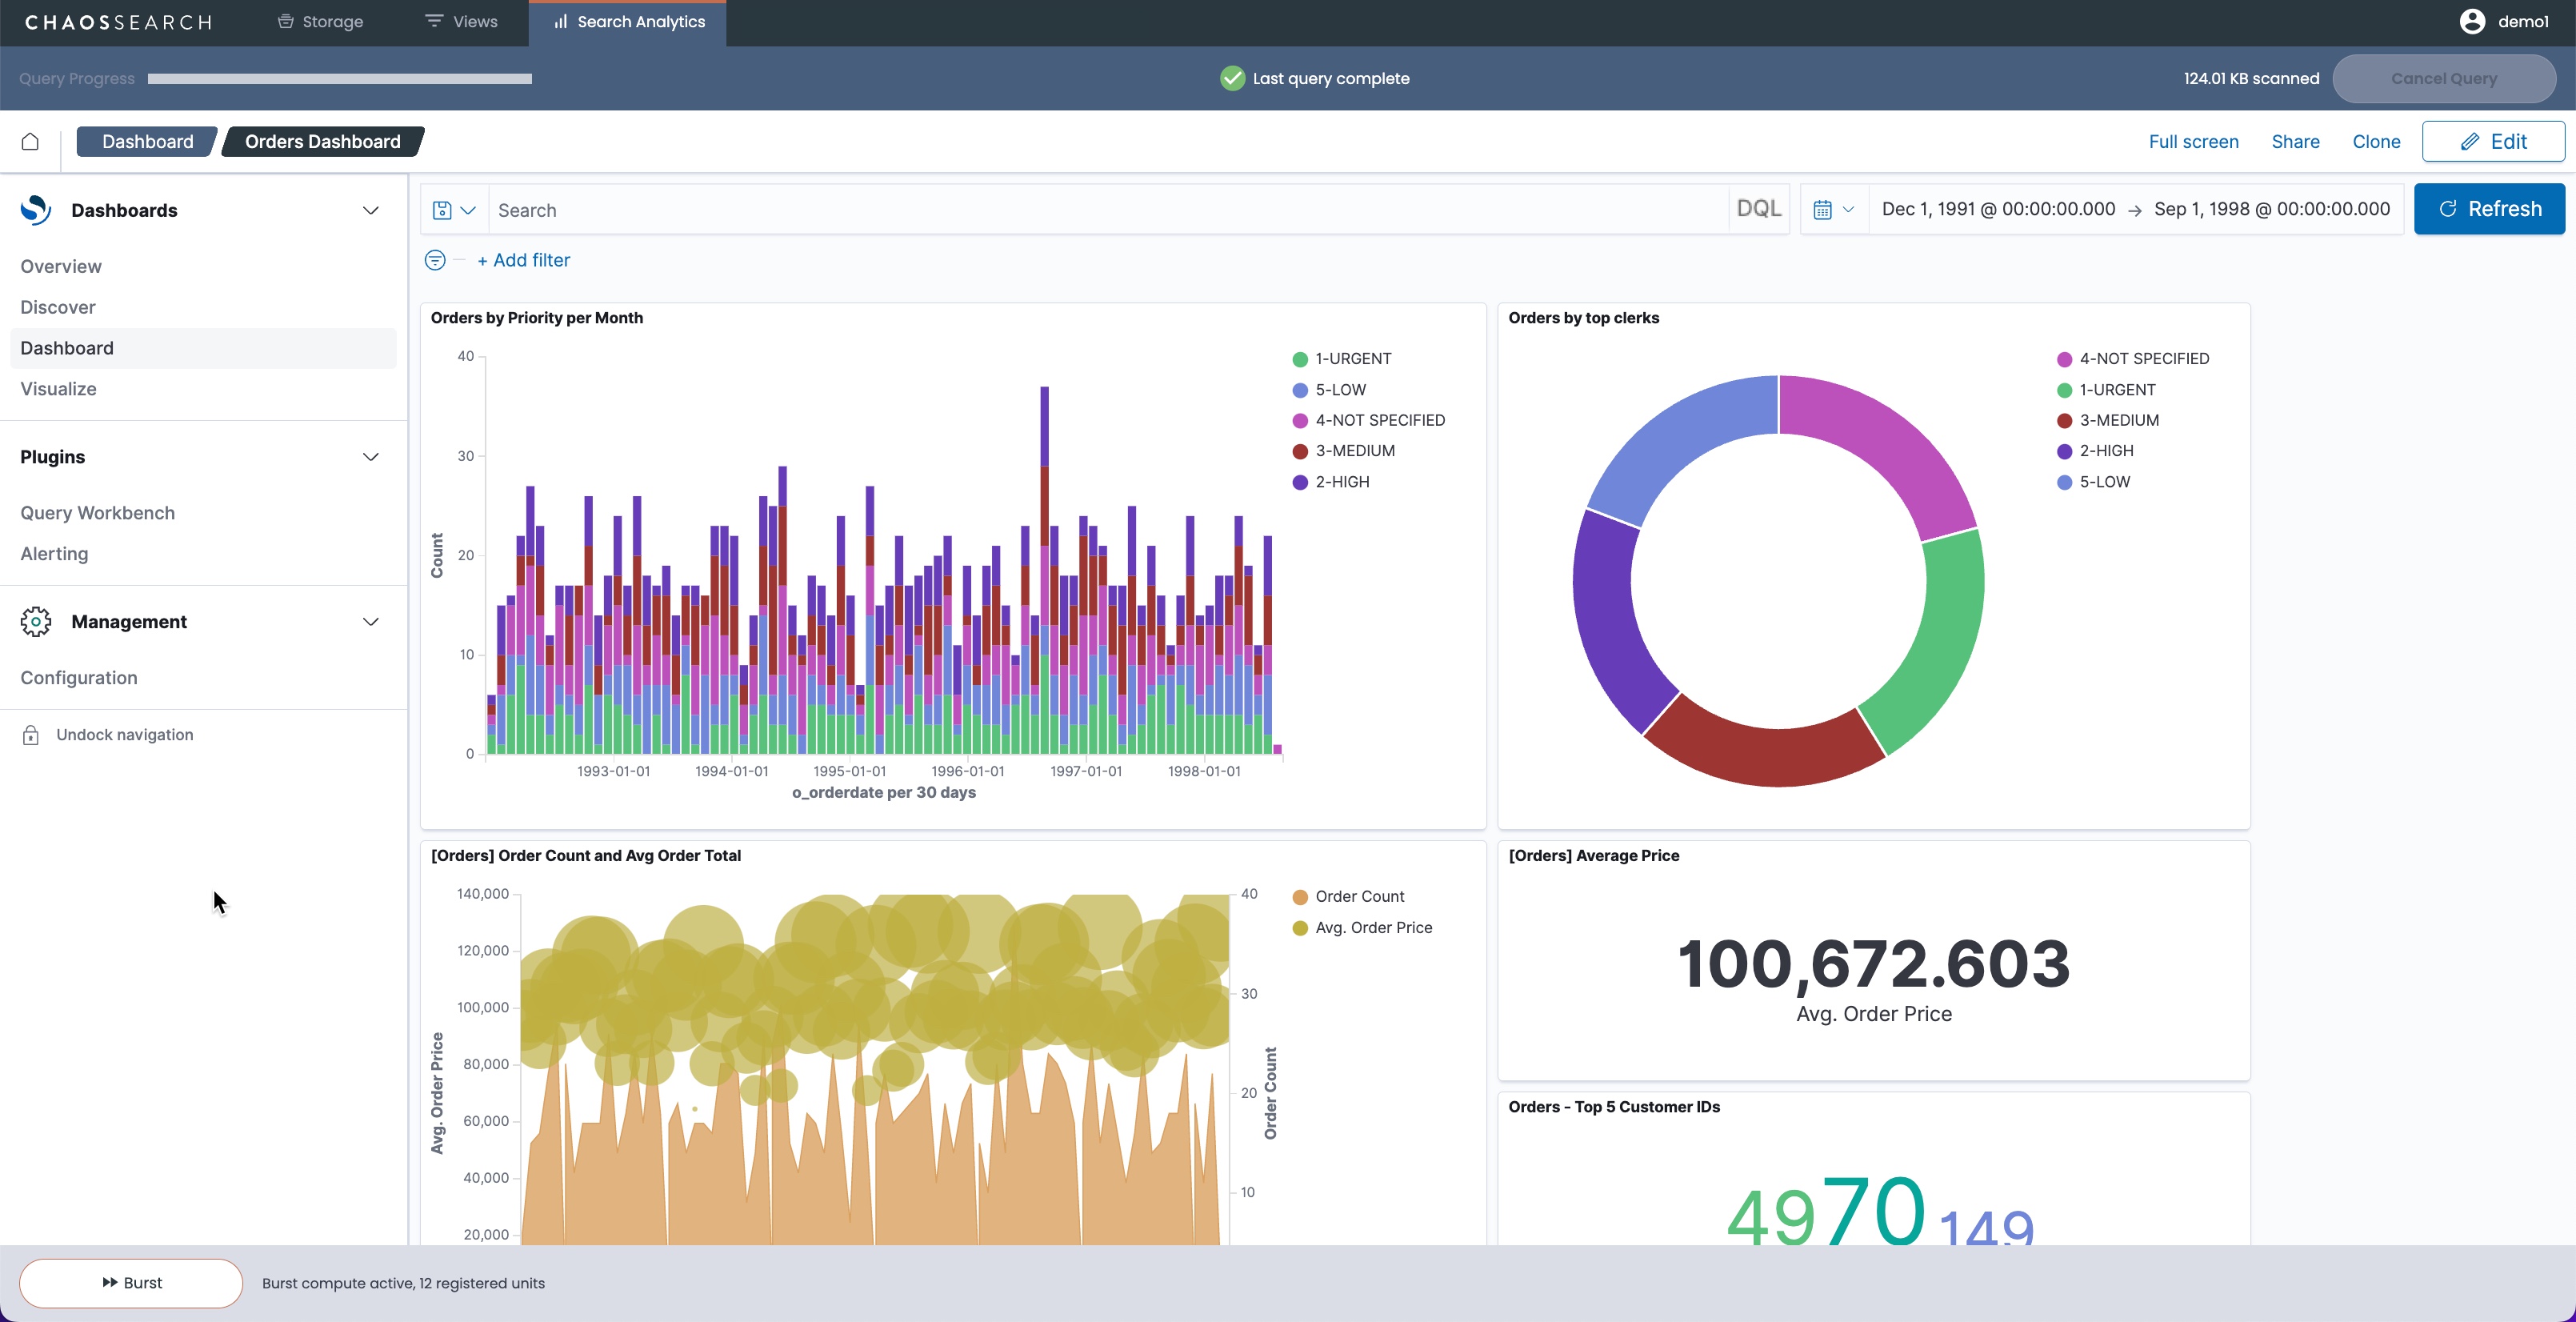
Dashboard designers can create a layout of visualizations that provide information about a service or other related topic area so that users can see how various factors compare or correlate to show behaviors, issues, or information.
Users can display dashboards, change time ranges, and drill down for more information or a closer look at the data.
Create a Dashboard
To create a dashboard:
- In the Dashboards window, click Create dashboard to open the dashboard editor.
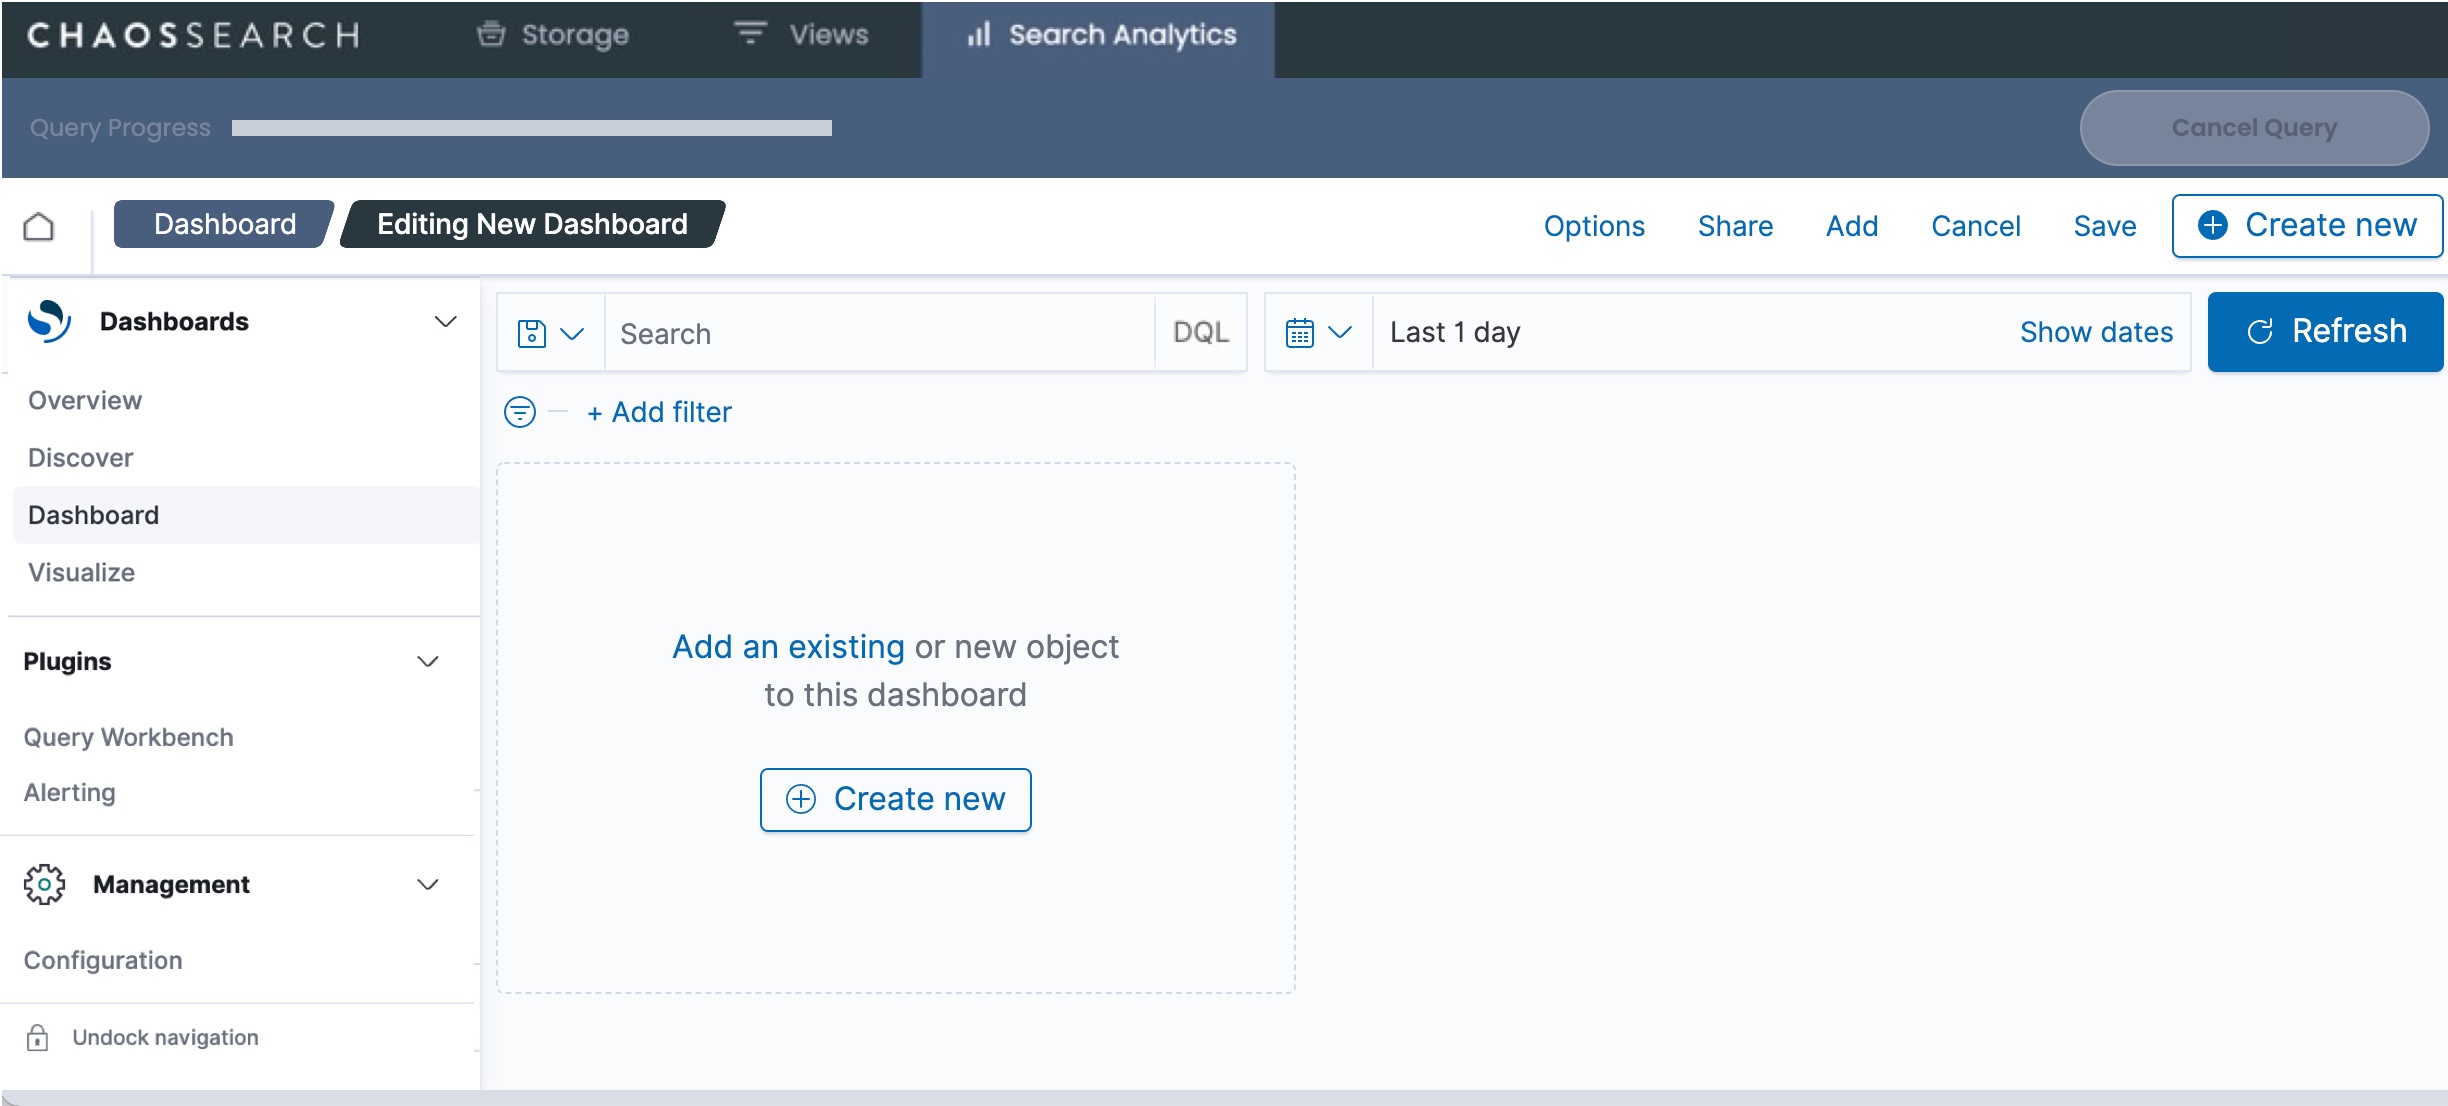
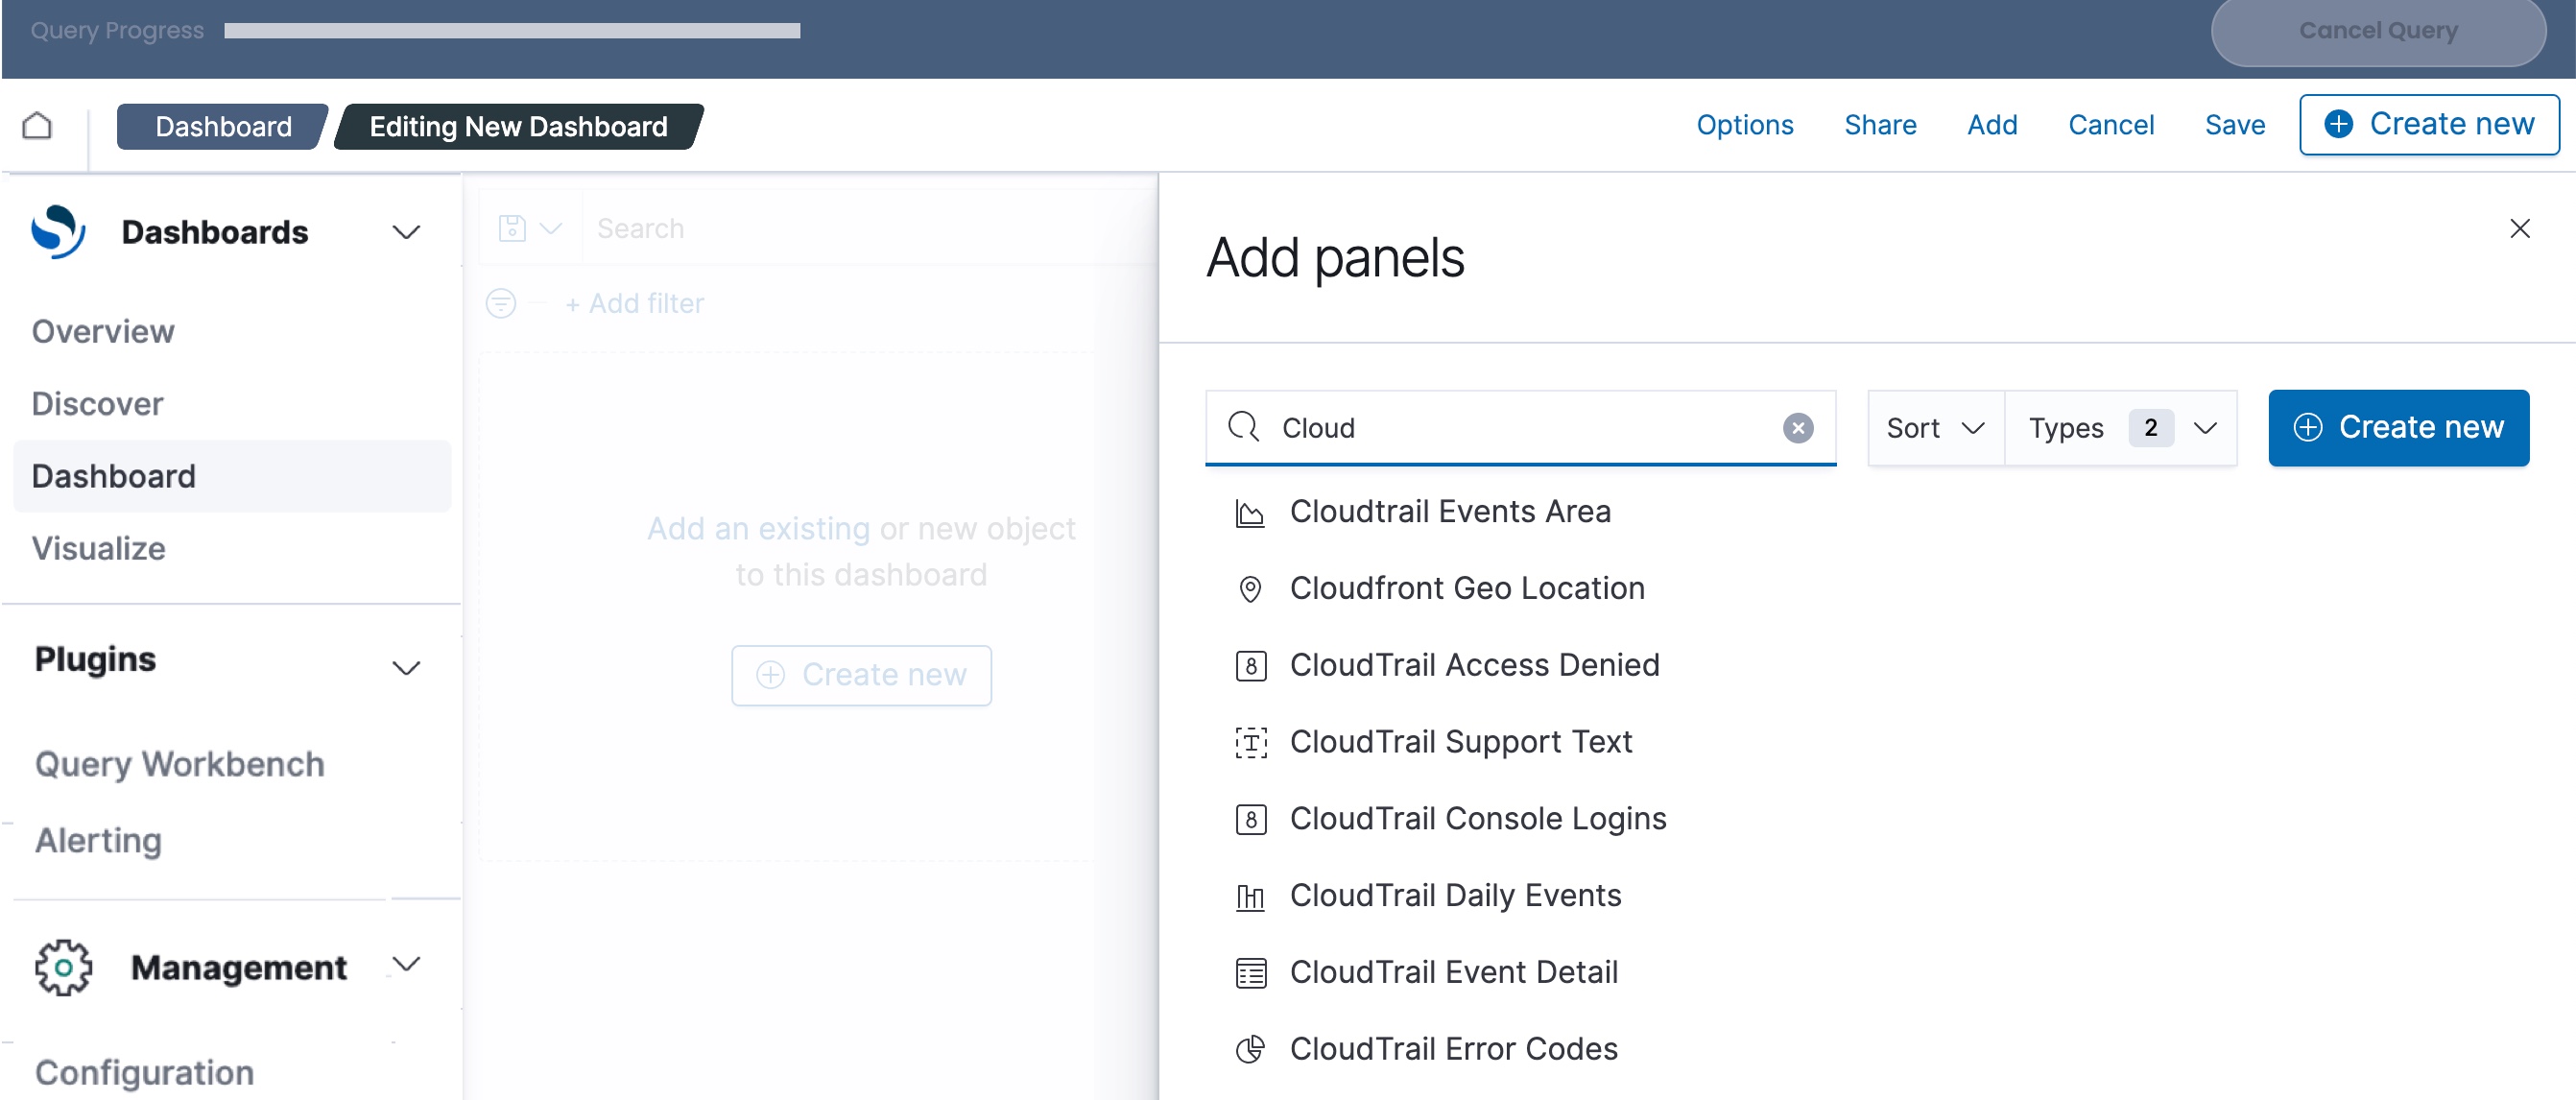
- You can add content to the dashboard panels in two ways:
- Click Create new to create a new visualization that you want to add to a panel. For the steps to add a visualization, see Creating Visualizations.
- Click Add an existing to select an existing visualization or saved query for the panel. You can filter and select a visualization for your panel.
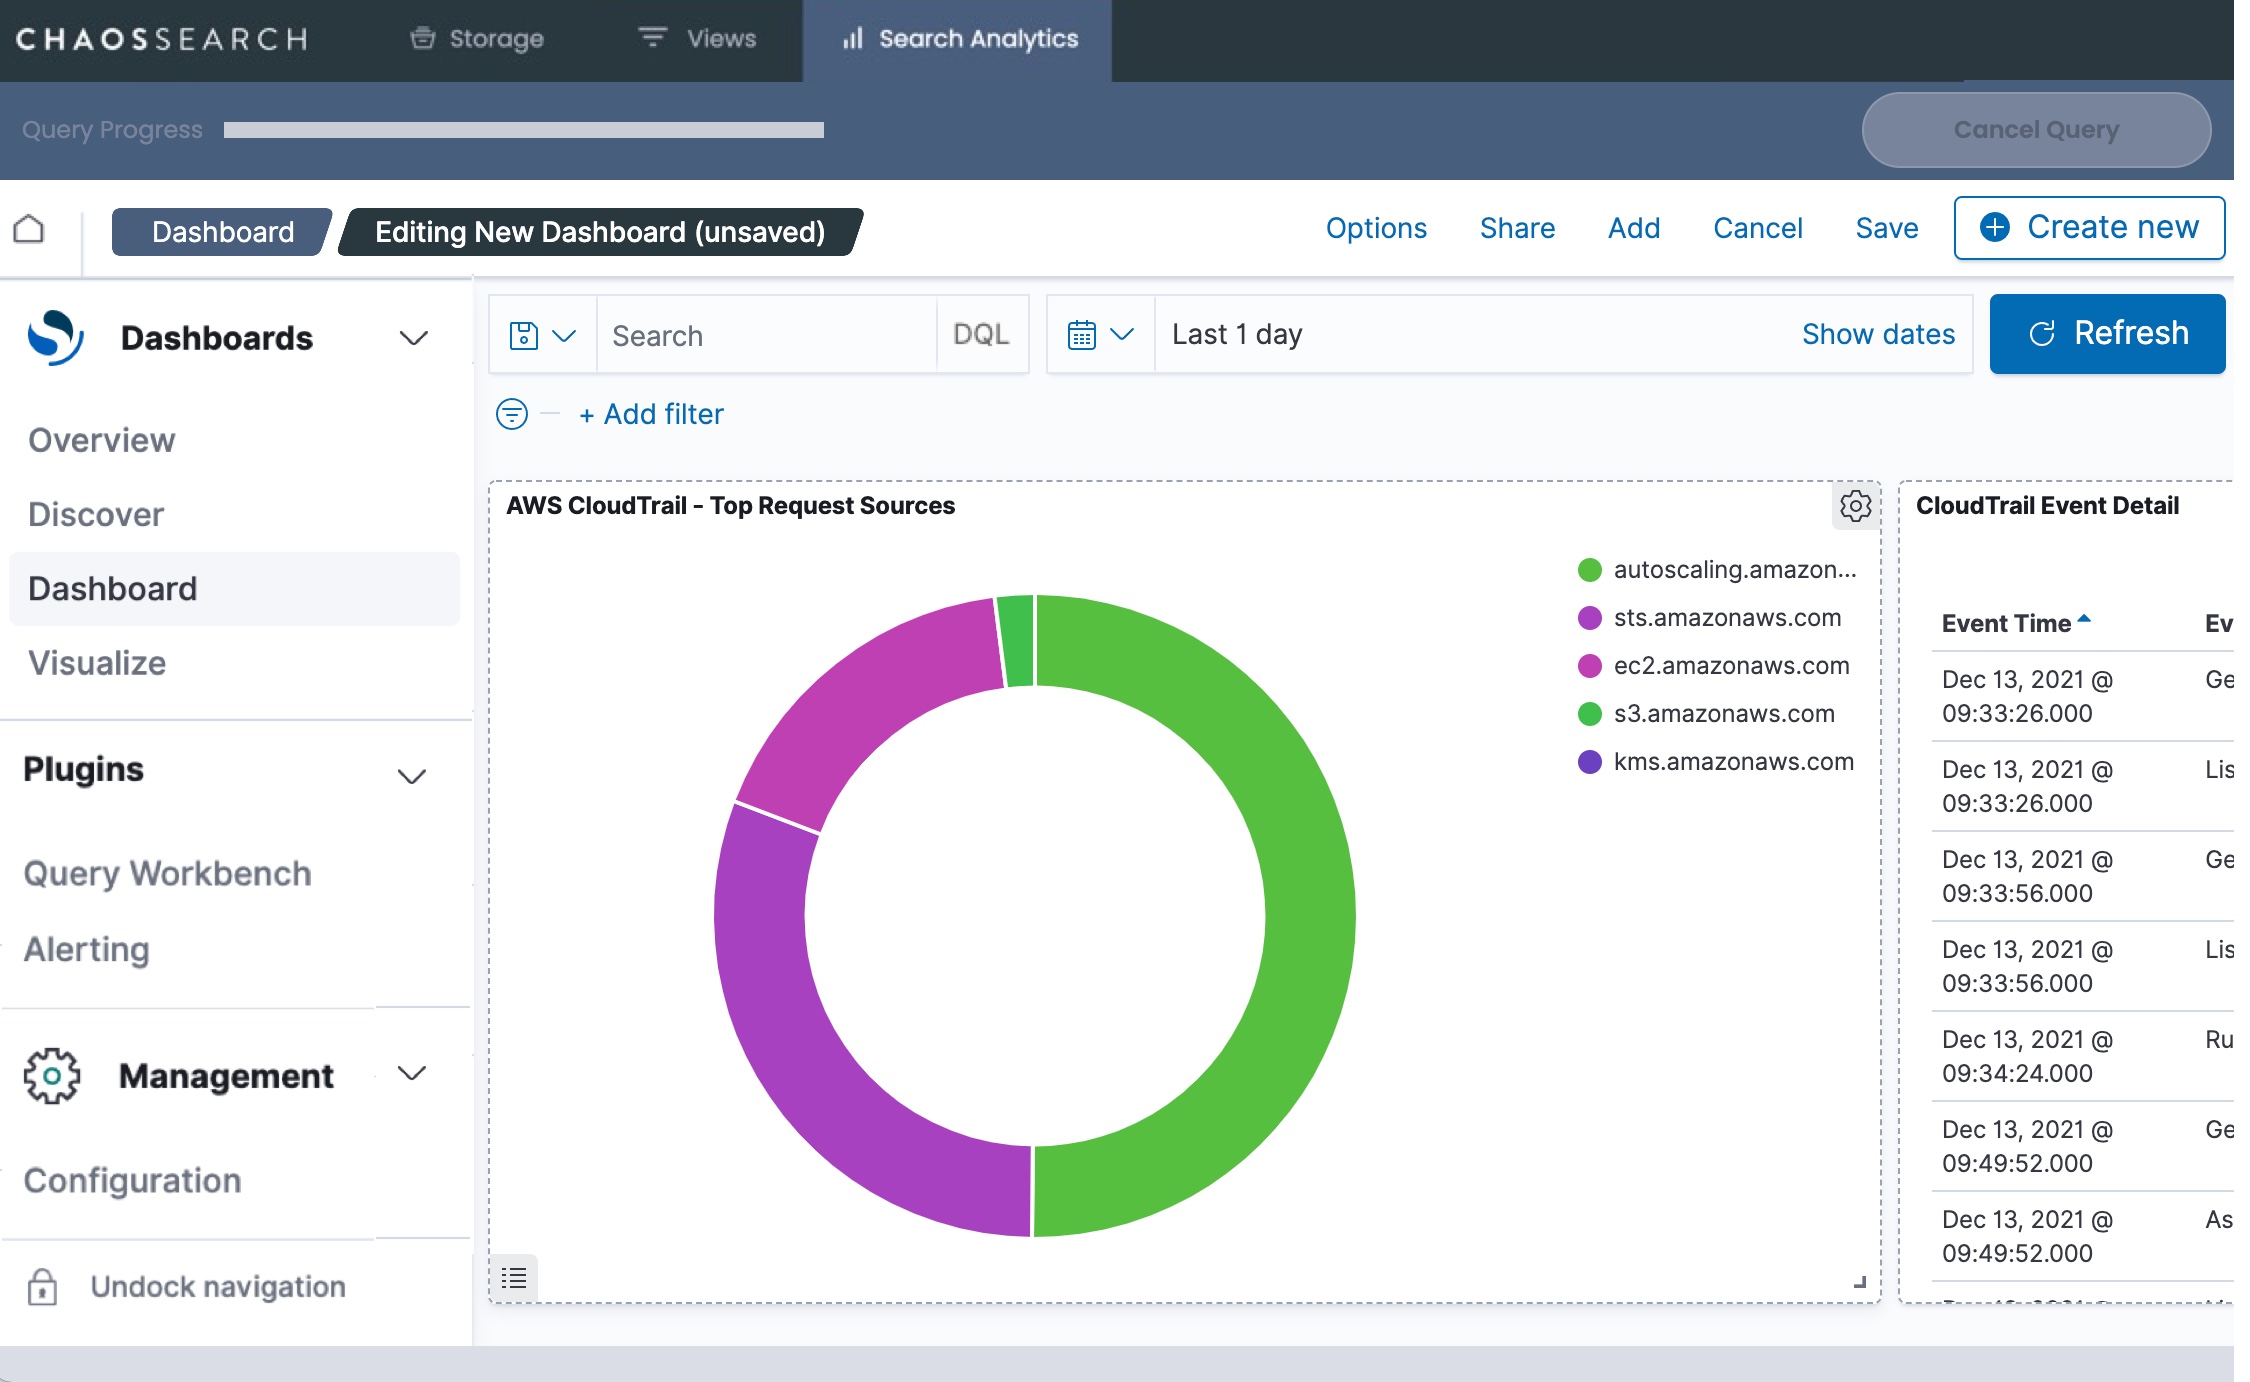
After you select a visualization, the panel updates to show the image that you selected. For example:
- You can continue to add more panels by clicking Add.
- You can click a panel heading area and drag the panel to move it to a different location. This helps you to relocate changes to show them in a specific order (or next to a specific chart neighbor) to aid the user interpretation. You can also resize panels to make them larger or smaller to best present the contents.
- When you have completed the dashboard design, click Save. The Save Dashboard window opens.

- Type a Title for the dashboard, and optionally, a Description.
- Optionally, select Store time with dashboard if you want to save the selected time filter with the dashboard.
- Click Save. The new dashboard is added to the Dashboards list, and the system updates the dashboard on your screen.
Organize the Dashboard
The visualization and query elements in a dashboard are contained within panels that can be moved and customized.
Moving Panels
Click and hold the top heading of a panel and drag to the desired position.
Resizing Panels
Click and drag the bottom right corner of a panel to the desired size.
Additional Actions
When the dashboard page is in Edit mode, you can click the gear menu in the upper right corner of a panel for additional options:
- Edit visualization - Open a visualization in the Visualize editor or a query in the Discover editor
- Clone panel - Copies the panel contents to a new panel added to the right
- Edit panel title - Changes the panel title text, and/or displays options to show or hide the panel title
- Inspect - Displays a pop-up window with a closer look at the panel data
- Maximize panel - Expands the panel to the page width to fill that row of the dashboard. (If a panel is already maximized, the option changes to Minimize to reduce the panel back to default width.)
- Replace panel - Displays the visualization/saved query picker to select an alternative set of contents for the panel
- Delete from dashboard - Removes the panel from the dashboard view.
NOTE:The Delete from dashboard option removes a panel from a dashboard. It does not delete the saved visualization or query.
When a dashboard is in view mode, the gear icon changes to an ellipses icon with two options: Inspect and Maximize panel (or Minimize).
Deleting a Dashboard
To delete a dashboard that you no longer want to use:
- In the Dashboards list, select one or more dashboards to delete. The system displays a Delete<number> dashboard link at the top of the list.

- Click Delete<number> dashboard. A confirmation window appears.

- Click Delete to remove the selected dashboard(s).
Updated about 1 year ago
What’s Next
Use dashboards and visualizations from other OpenSearch implementations