Add Annotations to a Chart
Add meaningful highlights and comments to your Superset charts with annotations.
Annotations can indicate events like world events or changes in your company or applications that could have impacts in the display of data in a visualization. For example, a decrease in activity might occur on a major holiday, or an implementation of a corporate merger and new data might cause trends to increase sharply with new volume additions. Annotations can help to call out these changes to your visualization users.
Before you can add an annotation to a chart, you must have defined annotation layers and at least one annotation as described in Create an Annotation.
To add an annotation to a chart:
-
Make sure that you are in the chart editor window. (You might be creating a new chart, or editing an existing chart that you opened from the Superset Home page, for example.)
-
In the middle column, scroll to the Annotations and layers section.
-
Click Add annotation layer.
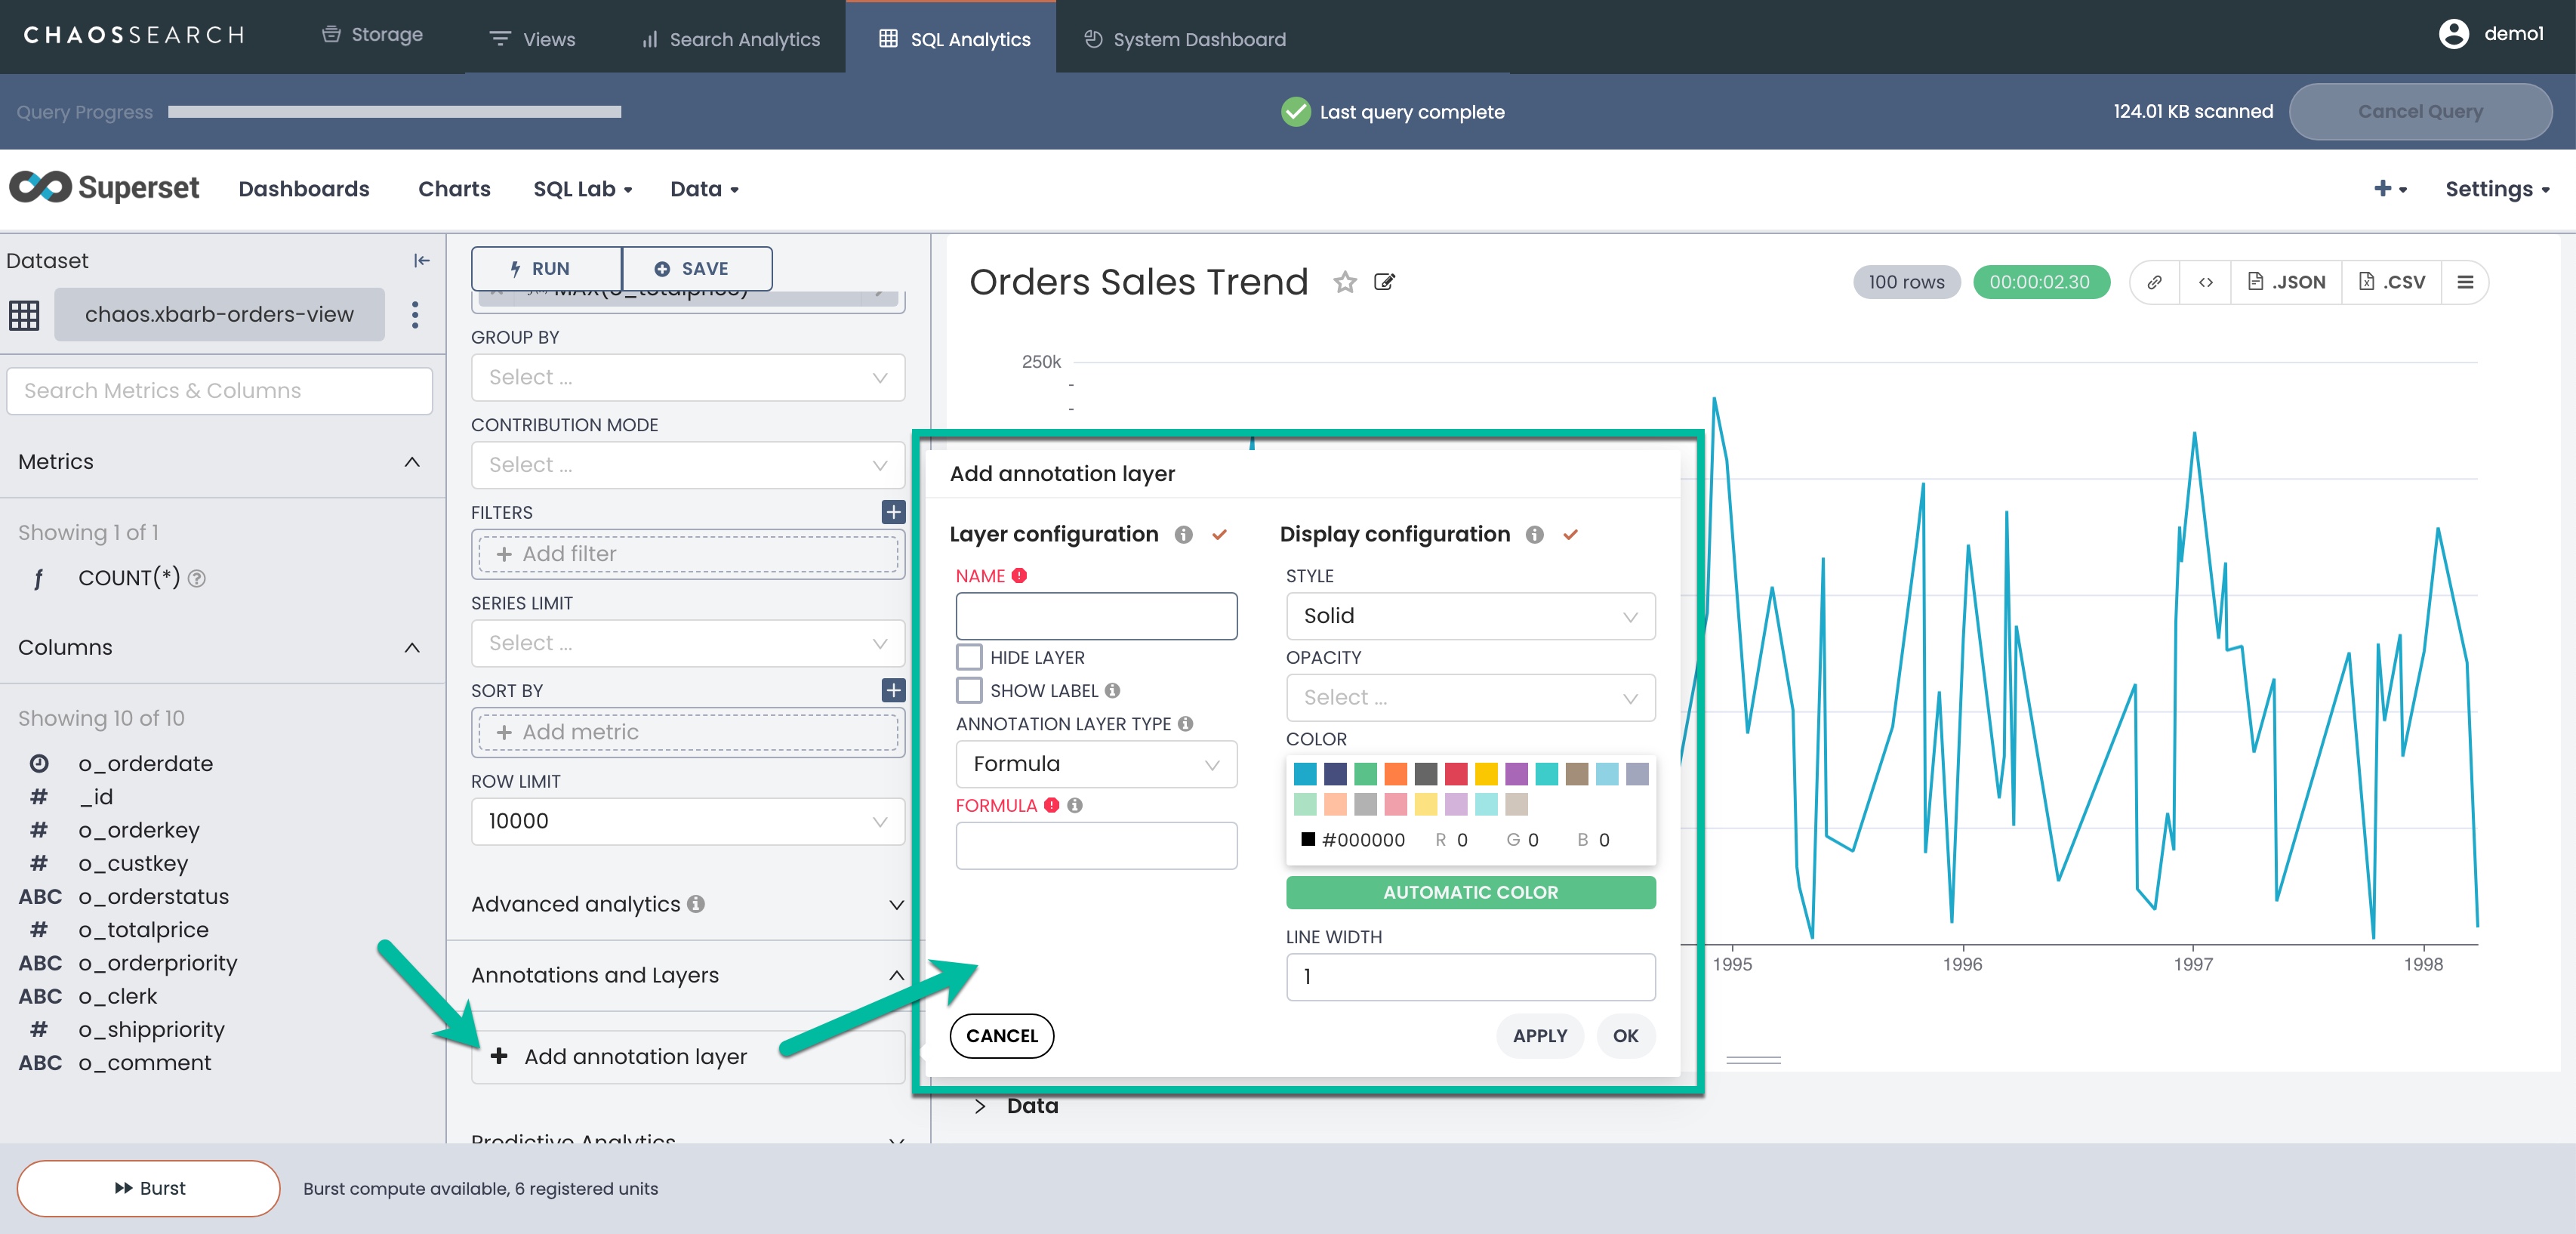
- In the Add annotation layer window, specify the following:
a. Type a name for the annotation layer being added to this chart.
b. You can choose to hide the layer; the effects of the layer will not be shown in the chart display until you unhide/show it.
c. You can choose to show or hide the labels for the annotations. If you choose to hide the labels, the layer lines that you specify will appear, but the labels will appear only when the user hovers over the label line.
d. Set the Annotation Layer Type to one of the following:
- Interval: Add annotation line(s) to charts to highlight one or more ranges of time with a start and end date. Interval annotations will be shown as a shaded area over the chart from the start and end dates defined for the interval. The annotation source could be:
- Superset Annotation—A defined annotation layer with annotations; or,
- Table—A table chart that includes start and end date values that can denote intervals.
- Event: Similar to interval, but the annotations show only as single lines in time; the start and end day of the date must be the same value.
- Time Series: Enables you to add additional time series to the chart. The source is another line chart that can come from different data sets.
- Formula: Formula based on depend variable x that is the milliseconds since Epoch Date (1 Jan 1970).
e. Set the Annotation Source, which is usually as Superset annotation or could be a Table or Line chart depending on the layer type you selected.
f. For a Superset annotation source, in the Annotation Layer list, select the annotation layer that has the defined annotations created previously.
g. Optionally, use the Display configuration settings to control the appearance of the annotation symbol for the chart. You can specify line styles, opacity, colors, and pixel widths.

h. Click Apply or OK and then Run Query to see the annotation(s) in the chart. A sample follows.
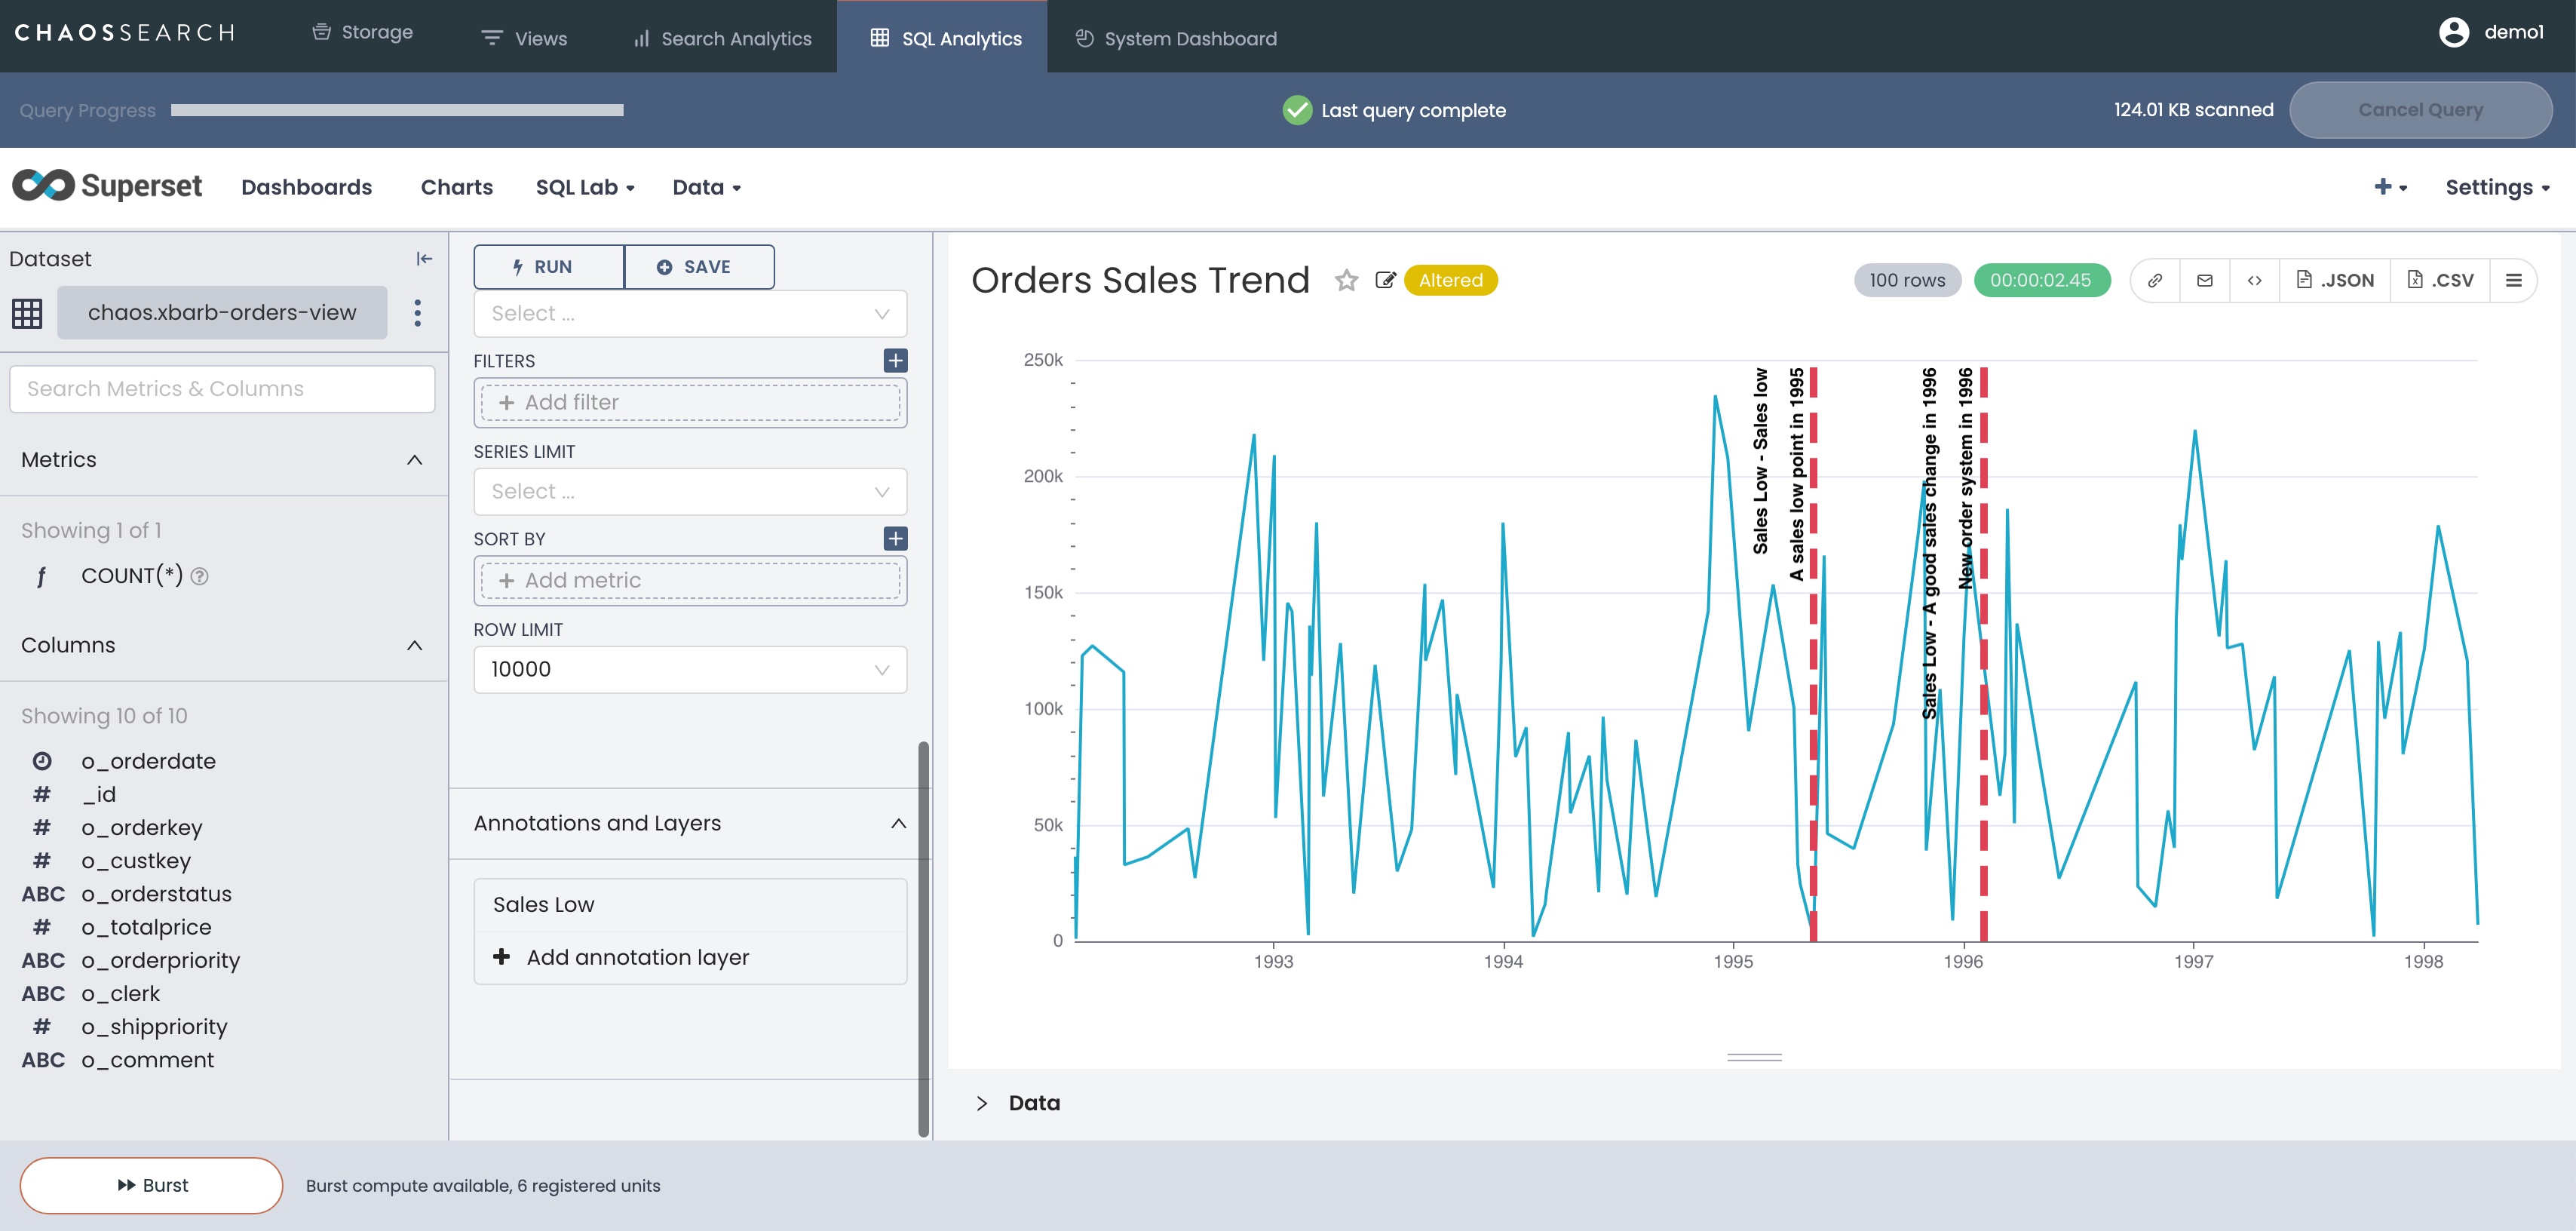
- If the annotations are correct and in the format that you want, click Save to save the chart with the annotations. You can overwrite the current chart, or save it with a different name to have an annotated and unannotated version. You can also choose to add it to a dashboard.
Updated about 1 year ago