AWS Visualizations
Review some sample Search Analytics dashboards and visualizations for popular Amazon services.

Amazon Web Services (AWS) is a comprehensive and broadly adopted cloud platform, offering over 175 fully featured services from data centers globally. Millions of customers—including the fastest-growing startups, largest enterprises, and leading government agencies—are using AWS to lower costs, become more agile, and innovate faster.
ChaosSearch includes some templates of pre-built visualizations with the relevant fields for popular AWS applications and services. The templates can be applied to a view that you've created for the related application using from the Views page, and you can build a dashboard of the visualizations that are helpful for your users.
Sample dashboard NDJSON files are available.The example dashboards were created manually to highlight the pre-built visualizations. Contact your ChaosSearch Customer Success representative if you would like to obtain a copy of the NDJSON files for the dashboards.
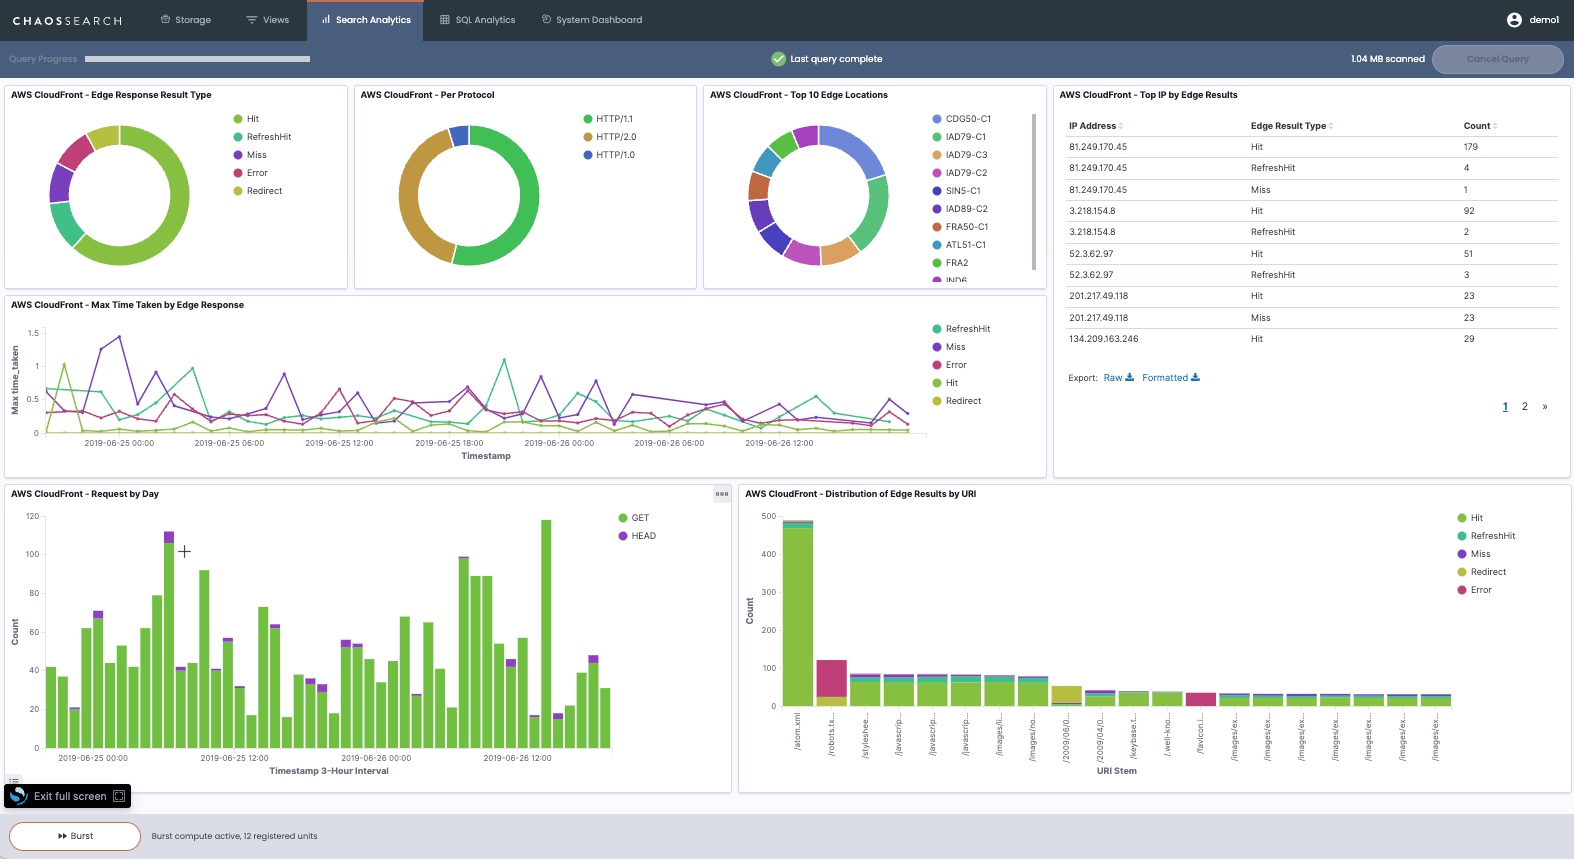
Amazon CloudFront Dashboard and Visualizations
Amazon CloudFront is a web service that speeds up distribution of your static and dynamic web content such as .html, .css, .js, and image files to your users. A sample AWS CloudFront dashboard for Search Analytics follows that uses the sample prebuilt visualizations to show information that could be helpful for your CloudFront analysts.
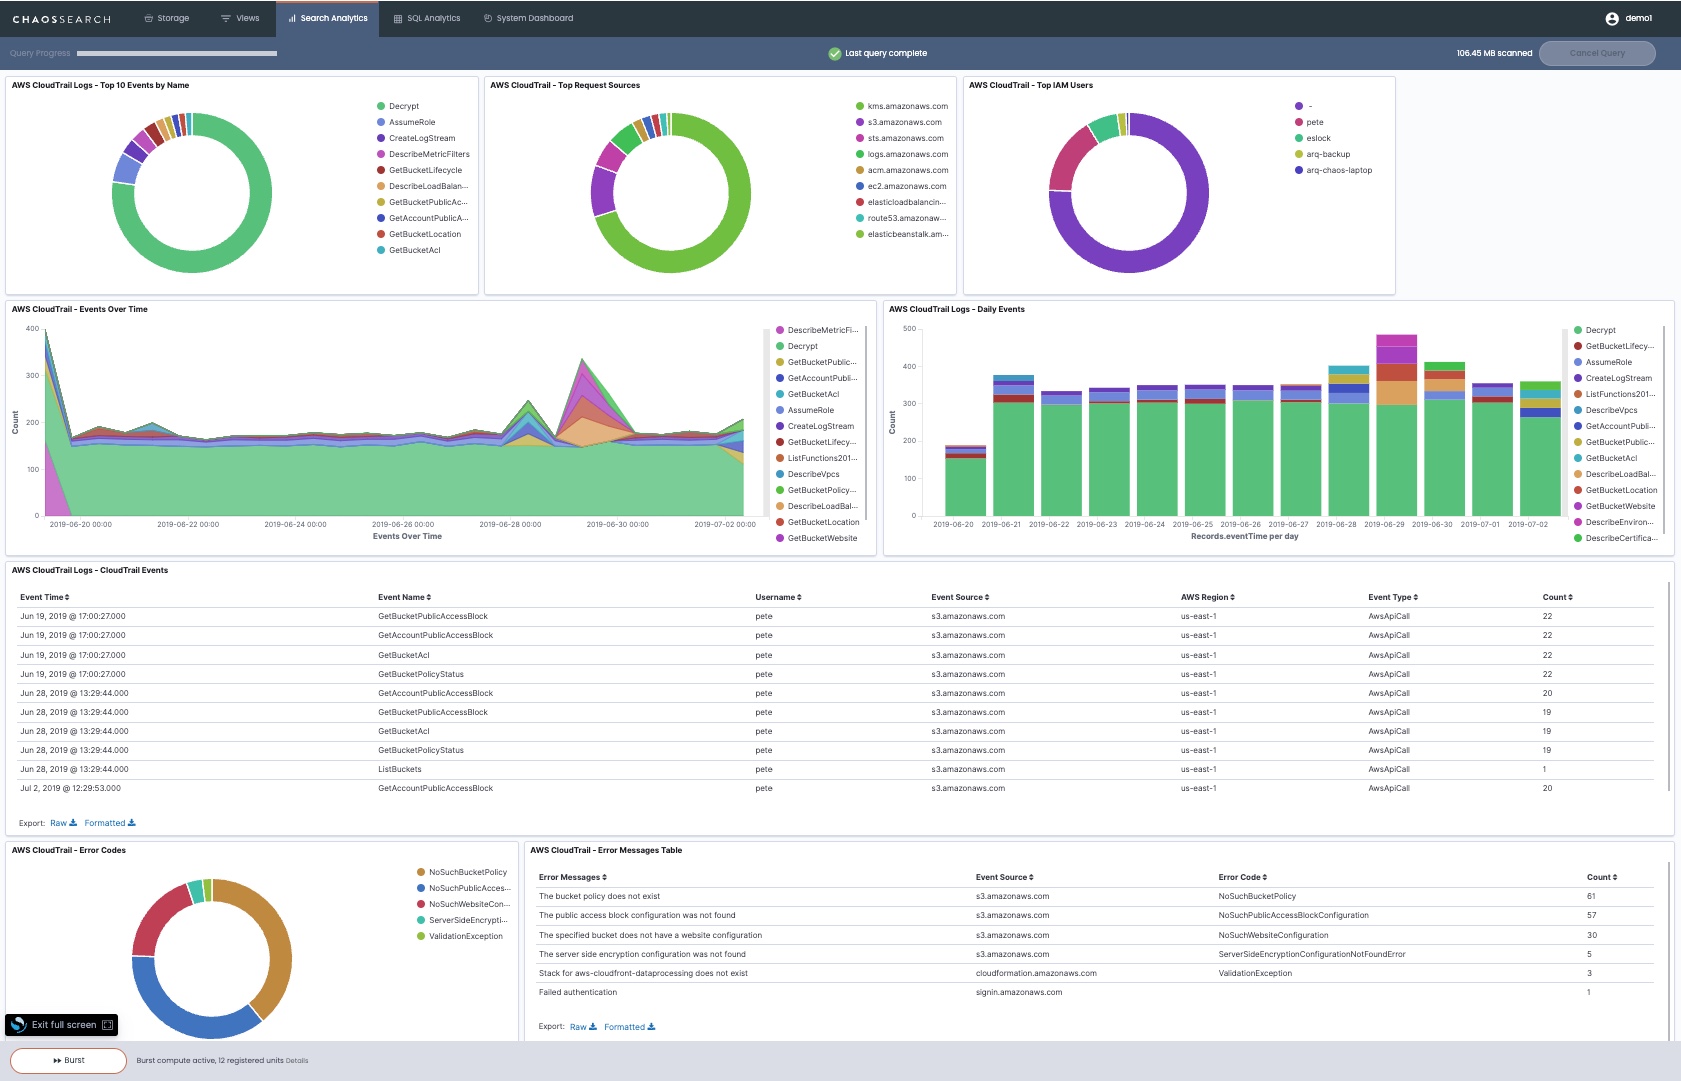
AWS CloudTrail Dashboard and Visualizations
AWS CloudTrail is an AWS service that helps you enable operational and risk auditing, governance, and compliance of your AWS account. Some out-of-the-box AWS CloudTrail visualizations are available as described in Import Pre-Built Visualizations. The following sample dashboard shows the visualizations.
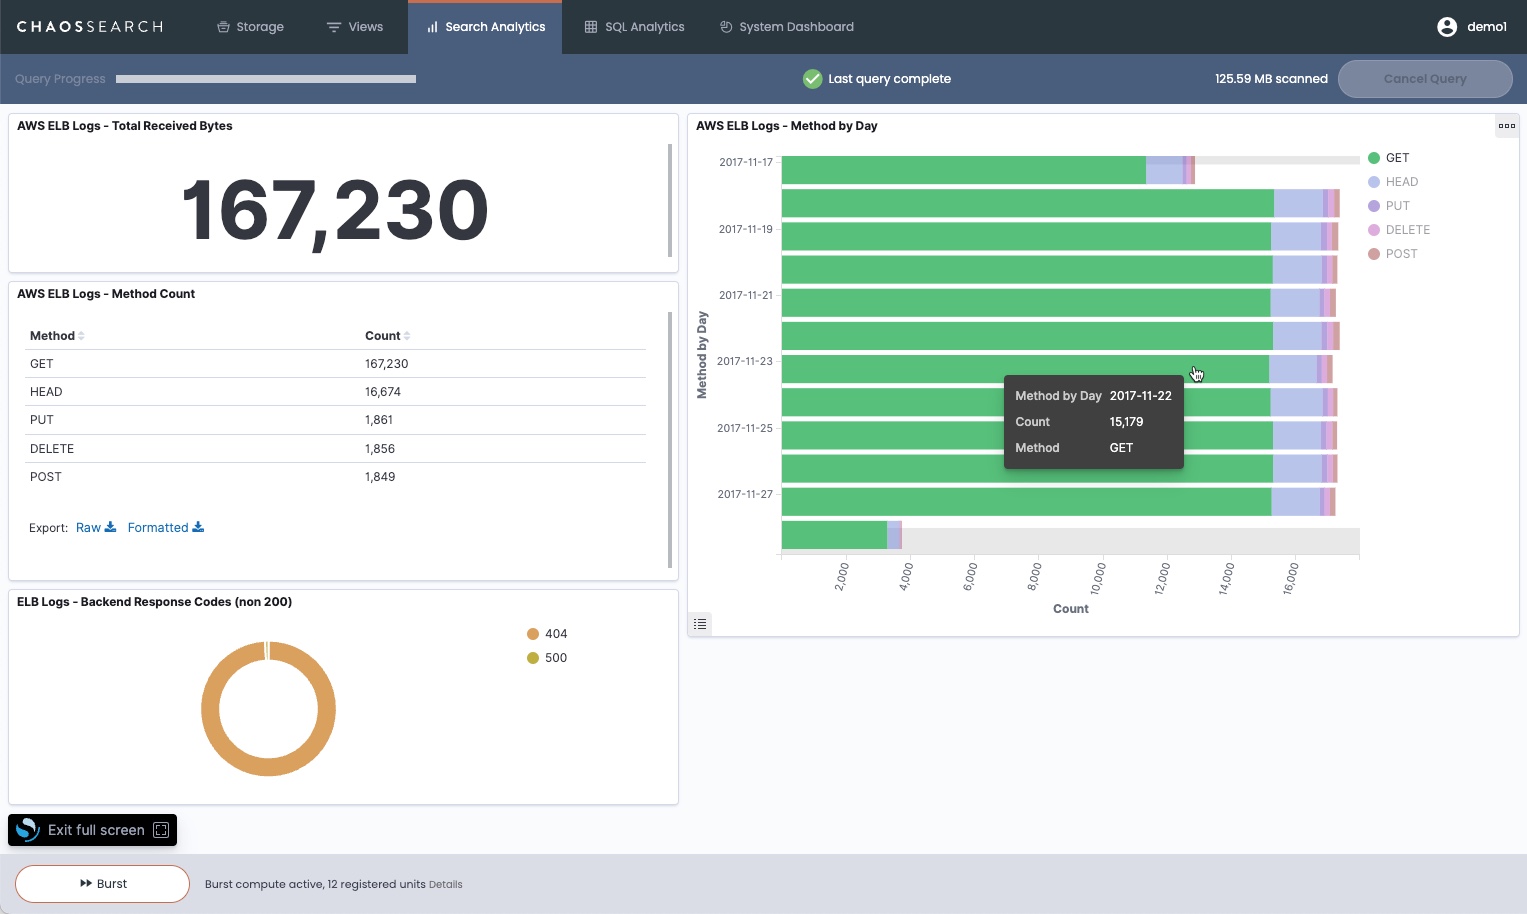
ELB Logs Dashboard and Visualizations
Elastic Load Balancing (ELB) automatically distributes incoming application traffic across multiple targets and virtual appliances in one or more Availability Zones (AZs). Some out-of-the-box AWS CloudTrail visualizations are available as described in Import Pre-Built Visualizations. The following sample dashboard shows the visualizations.
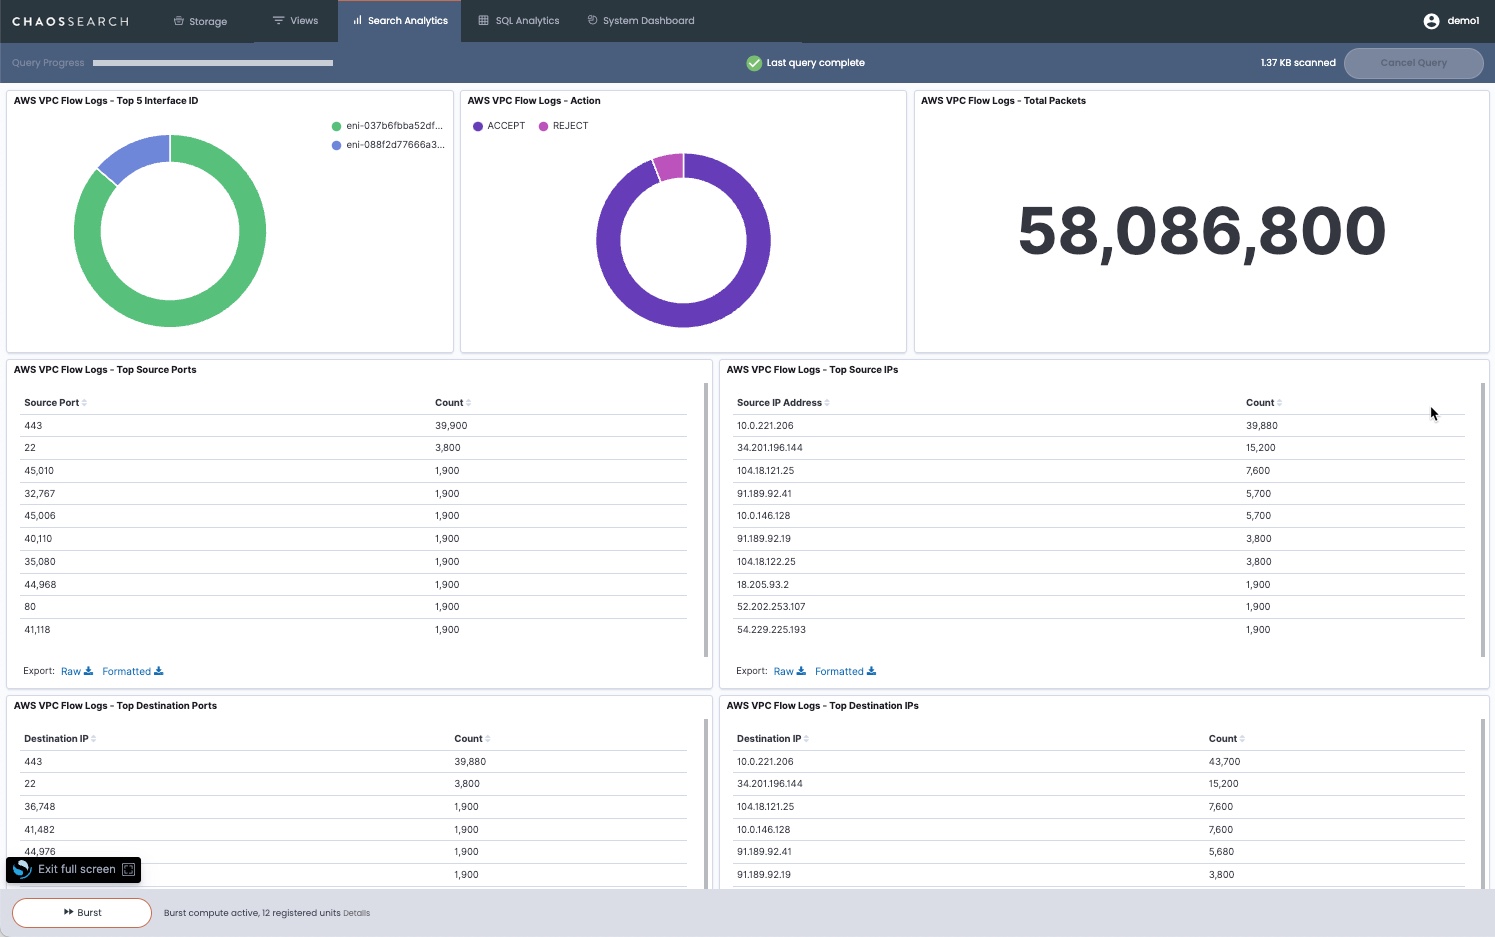
VPC Flow Logs Dashboard and Visualizations
VPC Flow Logs is a feature that enables you to capture information about the IP traffic going to and from network interfaces in your VPC. A sample VPC Flow Logs dashboard follows showing the sample visualizations that can be helpful for your analysts.
Updated about 1 year ago